
Multiple Regression Analysis
Synthetic methodological demonstration
Created from scratch with synthetic data and reconstructed context. No client data or original client document is used.
Analysis Plan
Three multiple linear regression analyses were performed to examine the research hypotheses. Regression 1 examined the associations of mentoring quality, peer research support, research resource adequacy, and structural barrier load with research self-efficacy. Regression 2 examined the associations of research self-efficacy, academic belonging, and structural barrier load with academic research engagement. Regression 3 examined the associations of academic research engagement, graduate research burnout, research self-efficacy, and academic belonging with persistence intentions.
Each regression model was adjusted for degree type, enrollment status, instruction modality, completed graduate methods/statistics courses, weekly paid-work hours outside the research role, first-generation status, international-student status, and caregiving responsibilities. Degree type, enrollment status, and instruction modality were entered as dummy-coded indicators, with master's, full-time, and primarily in-person students serving as the respective reference groups. Regression 1 was based on 900 cases, whereas Regressions 2 and 3 were each based on 891 cases because nine records were missing the complete academic research engagement score.
Before the regression models were interpreted, normality and homoscedasticity of the residuals were evaluated in the same manner as the reference report. Normality of the residuals was assessed using a histogram and Normal P-P plot of the standardized residuals. Homoscedasticity was assessed using a scatterplot of the standardized residuals against the standardized predicted values.
Research Hypotheses, Analysis Plan, and Power-Analysis Purpose
Three prespecified hypotheses were tested. H1 predicted positive associations of mentoring quality, peer research support, and research resource adequacy with research self-efficacy, and a negative association of structural barrier load with research self-efficacy. H2 predicted positive associations of research self-efficacy and academic belonging with academic research engagement, and a negative association of structural barrier load with engagement. H3 predicted positive associations of academic research engagement, research self-efficacy, and academic belonging with persistence intentions, and a negative association of graduate research burnout with persistence intentions. All hypotheses were tested after adjustment for the prespecified covariates.
Analysis plan. Three multiple linear regression models were fitted, one for each outcome, using the common covariates described above. Residual normality and homoscedasticity were examined before interpretation of the models. Support for each hypothesis was evaluated from the direction and statistical significance of the focal regression coefficients together with the overall model results.
Following the primary regression analyses, a complementary power and sensitivity analysis was performed in R. This additional analysis was conducted to quantify the resolving power of the fitted regression specifications and to inform future study planning, rather than to treat observed post hoc power as retrospective confirmation of the regression p-values.
Synthetic-data disclosure: GREPS is a synthetic case-study dataset. No real people were recruited, surveyed, or observed. Accordingly, the results presented below illustrate statistical methods and should not be reported as empirical evidence about real graduate students or universities.
Findings
Regression 1: Research Self-Efficacy
Assessment of the Assumptions of Regression 1
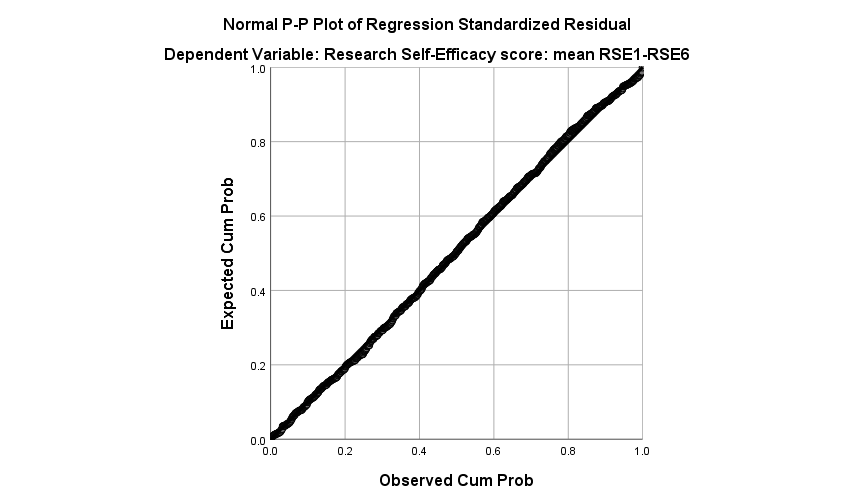
The histogram and Normal P-P plot of the standardized residuals were examined to assess the normality assumption for the research self-efficacy model. The residual distribution was approximately symmetric, with no substantial departure from a normal shape. Standardized residuals ranged from -3.173 to 3.102. Although two observations were marginally beyond an absolute standardized residual of 3, the overall pattern did not indicate pervasive nonnormality. The Normal P-P plot also showed that the observations followed the diagonal reference line reasonably closely. Taken together, these diagnostic results indicated that the normality assumption was reasonably satisfied for Regression 1.
Figure 1
Histogram of standardized residuals for the research self-efficacy regression model
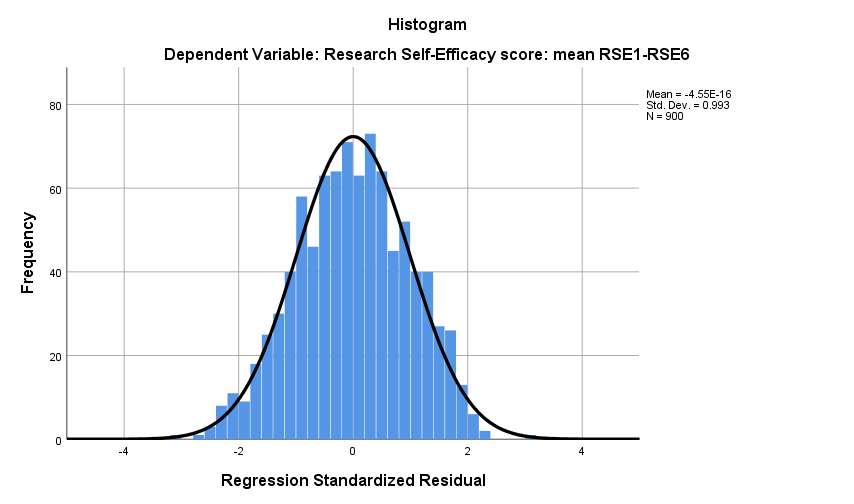
Figure 2
Normal P-P plot of standardized residuals for the research self-efficacy regression model
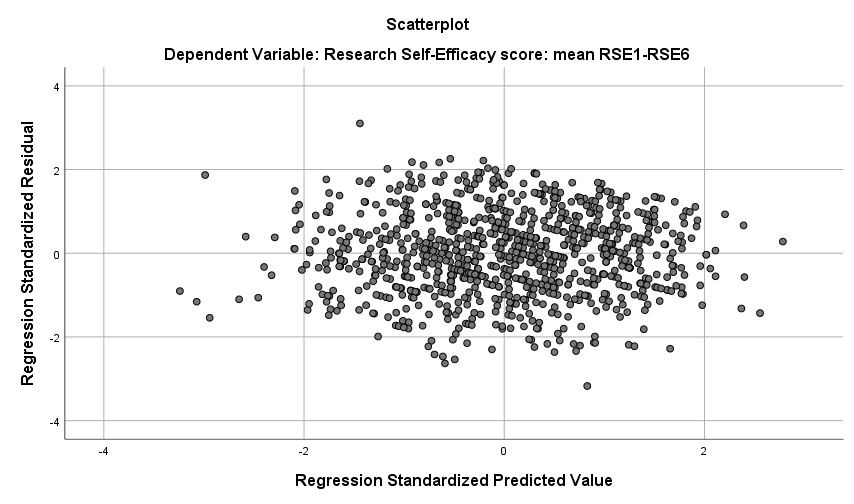
Homoscedasticity was assessed using the scatterplot of standardized residuals against standardized predicted values. The residuals were distributed around zero without a clear funnel-shaped pattern or systematic curvature, and the vertical spread was reasonably similar across the range of predicted values. Thus, the scatterplot suggested that the homoscedasticity assumption was reasonably satisfied for Regression 1.
Figure 3
Standardized residuals against standardized predicted values for the research self-efficacy regression model
Results of Regression 1
After the regression assumptions were assessed, the research self-efficacy model was examined. The results of the multiple regression analysis showed that the overall model was statistically significant, R Square = .265, F(13, 886) = 24.519, p < .001. The predictors explained 26.5% of the variance in research self-efficacy, and the adjusted R Square was .254.
As shown in Table 3, mentoring quality was a statistically significant positive predictor of research self-efficacy (B = .298, Beta = .312, p < .001). Peer research support (B = .165, Beta = .171, p < .001) and research resource adequacy (B = .170, Beta = .126, p < .001) were also statistically significant positive predictors, whereas structural barrier load was a statistically significant negative predictor (B = -.164, Beta = -.116, p < .001). Among the covariates, completed graduate methods/statistics courses was positively associated with research self-efficacy (B = .143, p < .001), while international-student status was negatively associated with research self-efficacy (B = -.189, p = .037). None of the remaining covariates were statistically significant at the .05 level.
Table 1
Model summary for Regression 1 predicting research self-efficacy
| R | R Square | Adjusted R Square | Std. Error of the Estimate | Durbin-Watson |
|---|---|---|---|---|
| .514 | .265 | .254 | 1.08342 | 2.067 |
Table 2
ANOVA results for Regression 1 predicting research self-efficacy
| Source | Sum of Squares | df | Mean Square | F | p-value |
|---|---|---|---|---|---|
| Regression | 374.143 | 13 | 28.780 | 24.519 | < .001 |
| Residual | 1039.990 | 886 | 1.174 | ||
| Total | 1414.133 | 899 |
Table 3
Parameter estimates for Regression 1 predicting research self-efficacy
| Unstandardized Coefficients | Standardized Coefficients | t | p-value | ||
|---|---|---|---|---|---|
| Predictor | B | Std. Error | Beta | t | p-value |
| Constant | 2.252 | .299 | 7.539 | < .001 | |
| Mentoring Quality | .298 | .030 | .312 | 9.797 | < .001 |
| Peer Research Support | .165 | .030 | .171 | 5.490 | < .001 |
| Research Resource Adequacy | .170 | .040 | .126 | 4.226 | < .001 |
| Structural Barrier Load | -.164 | .044 | -.116 | -3.697 | < .001 |
| Research doctorate/PhD (vs. master's) | -.002 | .075 | -.001 | -.028 | .978 |
| Part-time (vs. full-time) | -.051 | .095 | -.017 | -.540 | .590 |
| Hybrid (vs. primarily in-person) | -.062 | .082 | -.023 | -.751 | .453 |
| Primarily online (vs. primarily in-person) | -.050 | .108 | -.014 | -.465 | .642 |
| Completed methods/statistics courses | .143 | .028 | .151 | 5.165 | < .001 |
| Weekly paid-work hours | -.001 | .003 | -.006 | -.188 | .851 |
| First-generation student | -.141 | .077 | -.053 | -1.837 | .067 |
| International student | -.189 | .090 | -.061 | -2.088 | .037 |
| Caregiving responsibilities | -.011 | .083 | -.004 | -.138 | .890 |
Note. SPSS values displayed as .000 are reported as p < .001. The reference categories were master's, full-time, primarily in-person, non-first-generation, non-international, and no caregiving responsibilities, as applicable.
Hypothesis 1
To evaluate Hypothesis 1, the coefficients for mentoring quality, peer research support, research resource adequacy, and structural barrier load were examined after adjustment for the covariates. Mentoring quality (B = .298, p < .001), peer research support (B = .165, p < .001), and research resource adequacy (B = .170, p < .001) were statistically significant positive predictors, whereas structural barrier load (B = -.164, p < .001) was a statistically significant negative predictor. All four focal coefficients were statistically significant and in the hypothesized directions. Therefore, the results supported Hypothesis 1.
Regression 2: Academic Research Engagement
Assessment of the Assumptions of Regression 2
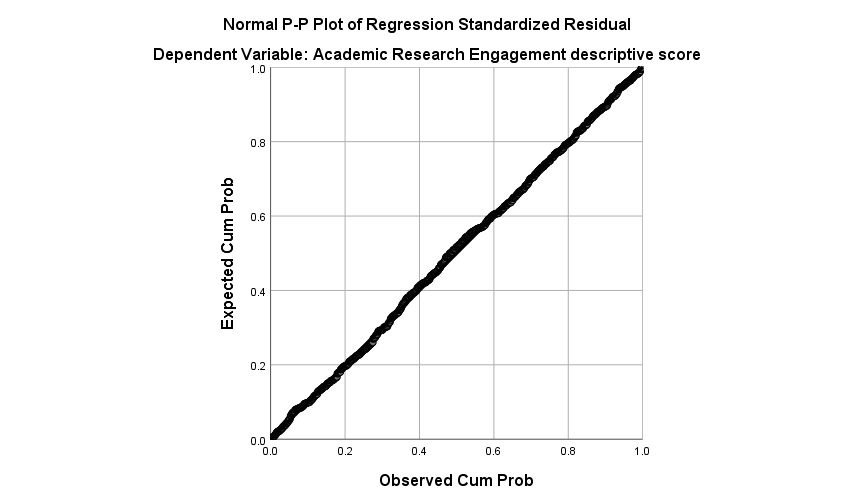
The histogram and Normal P-P plot of the standardized residuals were examined to assess normality for the academic research engagement model. The histogram was approximately symmetric and bell-shaped, and the observations in the Normal P-P plot remained close to the diagonal reference line. Standardized residuals ranged from -3.109 to 3.012, with only two observations marginally exceeding an absolute value of 3. The overall diagnostic pattern did not indicate a substantial departure from residual normality. Therefore, the normality assumption was considered reasonably satisfied for Regression 2.
Figure 4
Histogram of standardized residuals for the academic research engagement regression model
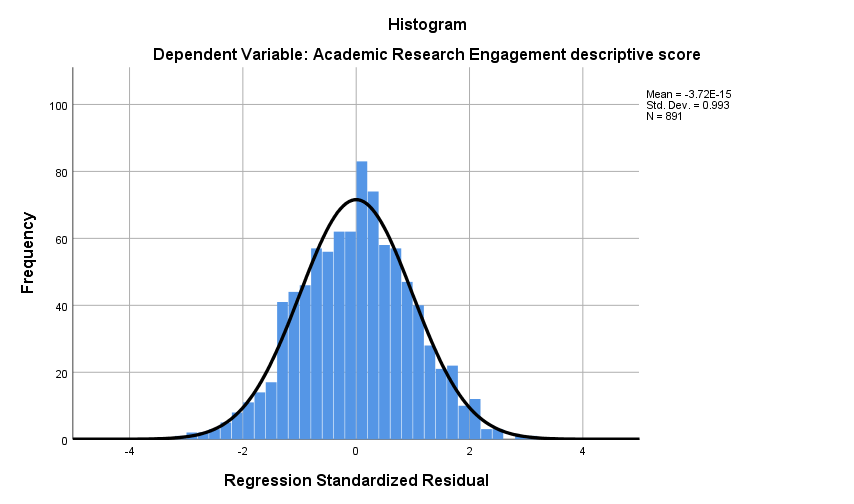
Figure 5
Normal P-P plot of standardized residuals for the academic research engagement regression model
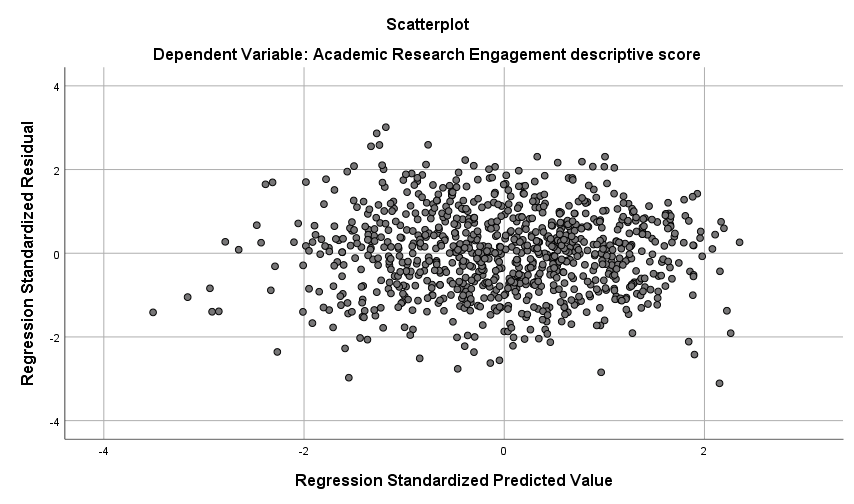
Homoscedasticity was assessed from the scatterplot of standardized residuals against standardized predicted values. The observations were distributed around the zero residual line without a pronounced funnel shape or systematic curve, and the dispersion was broadly comparable across the fitted-value range. These results suggested that the homoscedasticity assumption was reasonably satisfied for Regression 2.
Figure 6
Standardized residuals against standardized predicted values for the academic research engagement regression model
Results of Regression 2
The results of the multiple regression analysis showed that the academic research engagement model was statistically significant, R Square = .548, F(12, 878) = 88.775, p < .001. The predictors collectively explained 54.8% of the variance in academic research engagement, with an adjusted R Square of .542.
Research self-efficacy was a statistically significant positive predictor of academic research engagement (B = .369, Beta = .466, p < .001), and academic belonging was also a statistically significant positive predictor (B = .278, Beta = .366, p < .001). Structural barrier load was a statistically significant negative predictor (B = -.153, Beta = -.136, p < .001). Among the covariates, part-time enrollment was significantly associated with lower academic research engagement relative to full-time enrollment (B = -.143, p = .017). The remaining covariates were not statistically significant at the .05 level.
Table 4
Model summary for Regression 2 predicting academic research engagement
| R | R Square | Adjusted R Square | Std. Error of the Estimate | Durbin-Watson |
|---|---|---|---|---|
| .740 | .548 | .542 | .67362 | 2.039 |
Table 5
ANOVA results for Regression 2 predicting academic research engagement
| Source | Sum of Squares | df | Mean Square | F | p-value |
|---|---|---|---|---|---|
| Regression | 483.396 | 12 | 40.283 | 88.775 | < .001 |
| Residual | 398.407 | 878 | .454 | ||
| Total | 881.803 | 890 |
Table 6
Parameter estimates for Regression 2 predicting academic research engagement
| Unstandardized Coefficients | Standardized Coefficients | t | p-value | ||
|---|---|---|---|---|---|
| Predictor | B | Std. Error | Beta | t | p-value |
| Constant | 2.194 | .168 | 13.087 | < .001 | |
| Research Self-Efficacy | .369 | .020 | .466 | 18.596 | < .001 |
| Academic Belonging | .278 | .019 | .366 | 14.823 | < .001 |
| Structural Barrier Load | -.153 | .028 | -.136 | -5.454 | < .001 |
| Research doctorate/PhD (vs. master's) | .044 | .047 | .022 | .943 | .346 |
| Part-time (vs. full-time) | -.143 | .060 | -.058 | -2.395 | .017 |
| Hybrid (vs. primarily in-person) | .069 | .051 | .032 | 1.335 | .182 |
| Primarily online (vs. primarily in-person) | -.036 | .068 | -.012 | -.525 | .600 |
| Completed methods/statistics courses | -.013 | .018 | -.018 | -.760 | .447 |
| Weekly paid-work hours | 8.028E-5 | .002 | .001 | .041 | .967 |
| First-generation student | .032 | .048 | .015 | .669 | .503 |
| International student | .082 | .057 | .033 | 1.452 | .147 |
| Caregiving responsibilities | -.036 | .052 | -.016 | -.704 | .482 |
Note. SPSS values displayed as .000 are reported as p < .001. The reference categories were master's, full-time, primarily in-person, non-first-generation, non-international, and no caregiving responsibilities, as applicable.
Hypothesis 2
For Hypothesis 2, the regression coefficients for research self-efficacy, academic belonging, and structural barrier load were examined after adjustment for the covariates. Research self-efficacy (B = .369, p < .001) and academic belonging (B = .278, p < .001) were statistically significant positive predictors, whereas structural barrier load (B = -.153, p < .001) was a statistically significant negative predictor. The focal predictors were significant and in the hypothesized directions. Therefore, the results supported Hypothesis 2.
Regression 3: Persistence Intentions
Assessment of the Assumptions of Regression 3
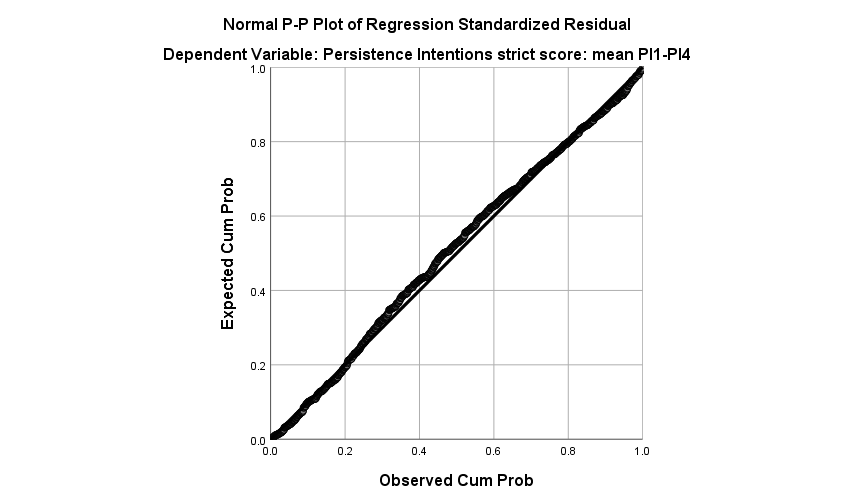
The histogram and Normal P-P plot of the standardized residuals were examined to assess normality for the persistence-intentions model. The residual distribution was broadly consistent with a normal shape, although a small degree of negative skew was evident. The observations in the Normal P-P plot remained generally close to the diagonal reference line. Standardized residuals ranged from -3.406 to 2.676, and two observations had standardized residuals below -3. Overall, the diagnostic results indicated that the residual-normality assumption was reasonably acceptable, while also identifying a small number of relatively extreme negative residuals.
Figure 7
Histogram of standardized residuals for the persistence-intentions regression model
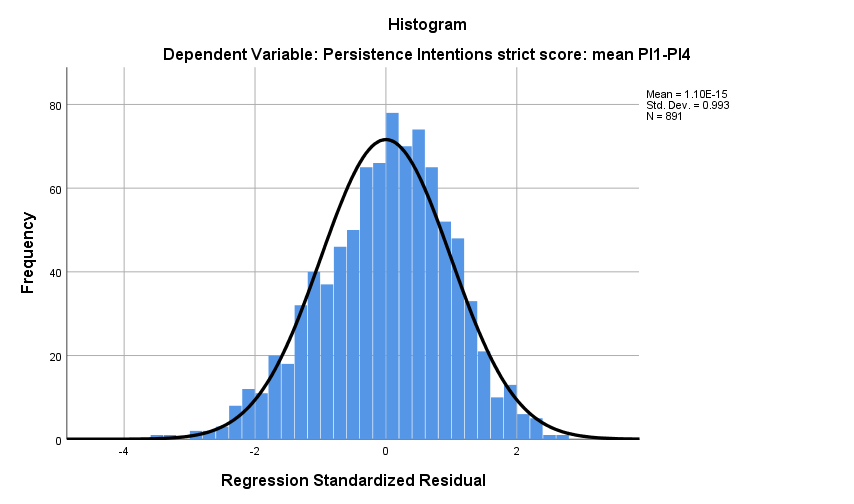
Figure 8
Normal P-P plot of standardized residuals for the persistence-intentions regression model
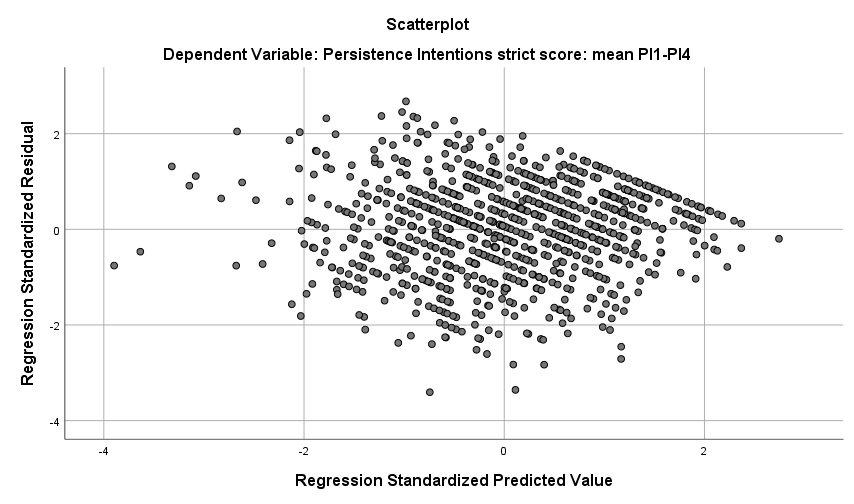
The scatterplot of standardized residuals against standardized predicted values showed a change in the vertical spread of the residuals across the fitted-value range rather than a completely uniform random cloud. In particular, the dispersion narrowed at higher predicted persistence-intention values. This pattern indicated that the homoscedasticity assumption was not fully satisfied for Regression 3. The conventional ordinary least squares results are reported below because they correspond to the prespecified analysis; however, the heteroscedasticity should be considered when the inferential results are interpreted. A robust-standard-error sensitivity analysis would be appropriate in a more advanced follow-up analysis.
Figure 9
Standardized residuals against standardized predicted values for the persistence-intentions regression model
Results of Regression 3
The results of the multiple regression analysis showed that the persistence-intentions model was statistically significant, R Square = .417, F(13, 877) = 48.269, p < .001. The predictors explained 41.7% of the variance in persistence intentions, and the adjusted R Square was .408.
Academic research engagement was a statistically significant positive predictor of persistence intentions (B = .282, Beta = .221, p < .001), whereas graduate research burnout was a statistically significant negative predictor (B = -.276, Beta = -.225, p < .001). Research self-efficacy (B = .179, Beta = .177, p < .001) and academic belonging (B = .195, Beta = .201, p < .001) were also statistically significant positive predictors. None of the covariates were statistically significant at the .05 level in this model.
Table 7
Model summary for Regression 3 predicting persistence intentions
| R | R Square | Adjusted R Square | Std. Error of the Estimate | Durbin-Watson |
|---|---|---|---|---|
| .646 | .417 | .408 | .97759 | 2.031 |
Table 8
ANOVA results for Regression 3 predicting persistence intentions
| Source | Sum of Squares | df | Mean Square | F | p-value |
|---|---|---|---|---|---|
| Regression | 599.698 | 13 | 46.131 | 48.269 | < .001 |
| Residual | 838.141 | 877 | .956 | ||
| Total | 1437.838 | 890 |
Table 9
Parameter estimates for Regression 3 predicting persistence intentions
| Unstandardized Coefficients | Standardized Coefficients | t | p-value | ||
|---|---|---|---|---|---|
| Predictor | B | Std. Error | Beta | t | p-value |
| Constant | 3.075 | .300 | 10.266 | < .001 | |
| Academic Research Engagement | .282 | .049 | .221 | 5.753 | < .001 |
| Graduate Research Burnout | -.276 | .039 | -.225 | -6.999 | < .001 |
| Research Self-Efficacy | .179 | .034 | .177 | 5.190 | < .001 |
| Academic Belonging | .195 | .031 | .201 | 6.235 | < .001 |
| Research doctorate/PhD (vs. master's) | -.085 | .068 | -.033 | -1.240 | .215 |
| Part-time (vs. full-time) | .014 | .087 | .005 | .165 | .869 |
| Hybrid (vs. primarily in-person) | -.051 | .075 | -.018 | -.682 | .496 |
| Primarily online (vs. primarily in-person) | .028 | .098 | .008 | .285 | .776 |
| Completed methods/statistics courses | -.018 | .026 | -.018 | -.687 | .492 |
| Weekly paid-work hours | -.001 | .003 | -.007 | -.231 | .817 |
| First-generation student | .019 | .070 | .007 | .267 | .790 |
| International student | -.040 | .082 | -.013 | -.487 | .626 |
| Caregiving responsibilities | .092 | .075 | .032 | 1.233 | .218 |
Note. SPSS values displayed as .000 are reported as p < .001. The reference categories were master's, full-time, primarily in-person, non-first-generation, non-international, and no caregiving responsibilities, as applicable.
Hypothesis 3
For Hypothesis 3, the regression coefficients for academic research engagement, graduate research burnout, research self-efficacy, and academic belonging were examined after adjustment for the covariates. Academic research engagement (B = .282, p < .001), research self-efficacy (B = .179, p < .001), and academic belonging (B = .195, p < .001) were statistically significant positive predictors, whereas graduate research burnout (B = -.276, p < .001) was a statistically significant negative predictor. Therefore, the conventional OLS results supported Hypothesis 3. The homoscedasticity concern identified above should remain part of the interpretation of this model.
Power and Sensitivity Analysis
Purpose of the Power Analysis
The three regression models had been estimated before the power analysis was conducted. Therefore, the primary purpose of the power analysis was not to calculate observed post hoc power and use it as evidence that the statistically significant findings were reliable. Instead, the analysis served as a sensitivity and future-study planning tool. Specifically, it examined how small an incremental focal-block effect could be detected with 80%, 90%, or 95% power at the observed analytic sample sizes; the power available for prespecified values of Cohen's f-squared; and the number of observations a future study would require to detect effects of those magnitudes with 80% or 90% power.
Analytic Method
For each hypothesis, the full regression model used in the primary analysis was compared with a reduced model containing only the common covariates. The difference in R-squared therefore represented the incremental variance attributable to the hypothesis-related focal predictor block after adjustment for degree type, enrollment status, instruction modality, completed graduate methods/statistics courses, weekly paid-work hours, first-generation status, international-student status, and caregiving responsibilities. The focal-block effect size was expressed as partial Cohen's f-squared. Power and sensitivity calculations were based on the general linear model F test with alpha set to .05.
f² = (R²full – R²reduced) / (1 – R²full)
The minimum detectable effect values reported below are sensitivity estimates indicating the smallest focal-block f-squared that the specified model could detect at a selected power level. These values should not be interpreted as the observed focal-block effect size. Similarly, the power estimates for f-squared = .01, .02, .05, and .15 represent scenario-based calculations rather than re-expressions of the observed p-values.
Table 10
Regression and focal-block effect-size summary from the R sensitivity analysis
| Hypothesis | N | R² | Focal ΔR² | Partial f² | Focal-block F | p-value |
|---|---|---|---|---|---|---|
| H1 | 900 | .2646 | .2323 | .3158 | 69.951 | < .001 |
| H2 | 891 | .5482 | .5163 | 1.1427 | 334.444 | < .001 |
| H3 | 891 | .4171 | .3991 | .6847 | 150.117 | < .001 |
Using conventional descriptive benchmarks, the focal-block effect was medium for Hypothesis 1 (f² = .3158) and large for Hypotheses 2 and 3 (f² = 1.1427 and .6847, respectively). These observed effect-size estimates are presented descriptively and are not used as retrospective evidence that the models were adequately powered.
Table 11
Minimum detectable focal-block effect sizes at selected target power levels
| Hypothesis | 80% power | 90% power | 95% power |
|---|---|---|---|
| H1 | .0135 | .0174 | .0210 |
| H2 | .0124 | .0161 | .0196 |
| H3 | .0136 | .0176 | .0212 |
At 80% power, the three regression specifications could detect focal-block effects of approximately f² = .0124 to .0136 or larger under the conventional fixed-predictor regression framework. At 90% power, the corresponding sensitivity range was approximately .0161 to .0176; at 95% power, it was approximately .0196 to .0212.
Power Findings for Hypothesis 1
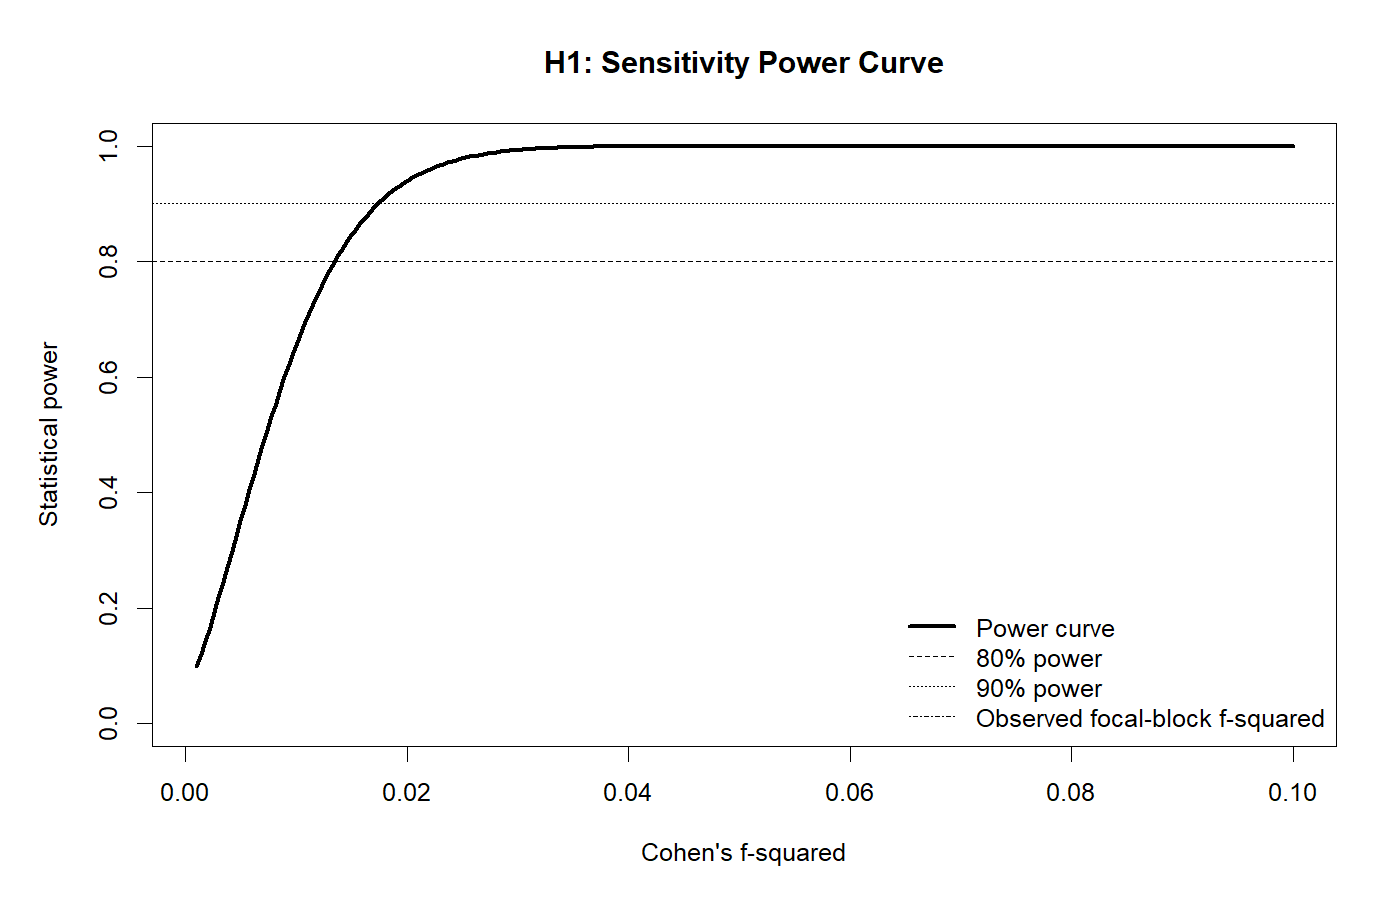
For Hypothesis 1, Mentoring Quality, Peer Research Support, Research Resource Adequacy, and Structural Barrier Load formed the four-predictor focal block for Research Self-Efficacy. With N = 900 and 13 total predictors, the focal block accounted for an additional ΔR² = .2323 beyond the covariates. The partial Cohen's f² was .3158, and the nested focal-block test was statistically significant, F = 69.951, p < .001. The sensitivity analysis showed minimum detectable f² values of .0135 at 80% power, .0174 at 90% power, and .0210 at 95% power.
Table 12
Power for prespecified focal-block effect sizes for Hypothesis 1
| Cohen f² | Statistical power |
|---|---|
| .01 | .6558 |
| .02 | .9395 |
| .05 | 1.0000 |
| .15 | 1.0000 |
For a prespecified effect of f² = .01, the Hypothesis 1 model did not reach 80% power. Power increased to .9395 for f² = .02 and was essentially 1.00 for f² = .05 and .15. Thus, under the conventional model assumptions, the observed sample size provided strong sensitivity for effects around f² = .02 or larger.
Table 13
Future sample-size requirements for the Hypothesis 1 model specification
| Cohen f² | Required N at 80% power | Required N at 90% power |
|---|---|---|
| .01 | 1,208 | 1,555 |
| .02 | 611 | 785 |
| .05 | 253 | 322 |
| .15 | 94 | 117 |
Figure 10
Sensitivity power curve for Hypothesis 1
Power Findings for Hypothesis 2
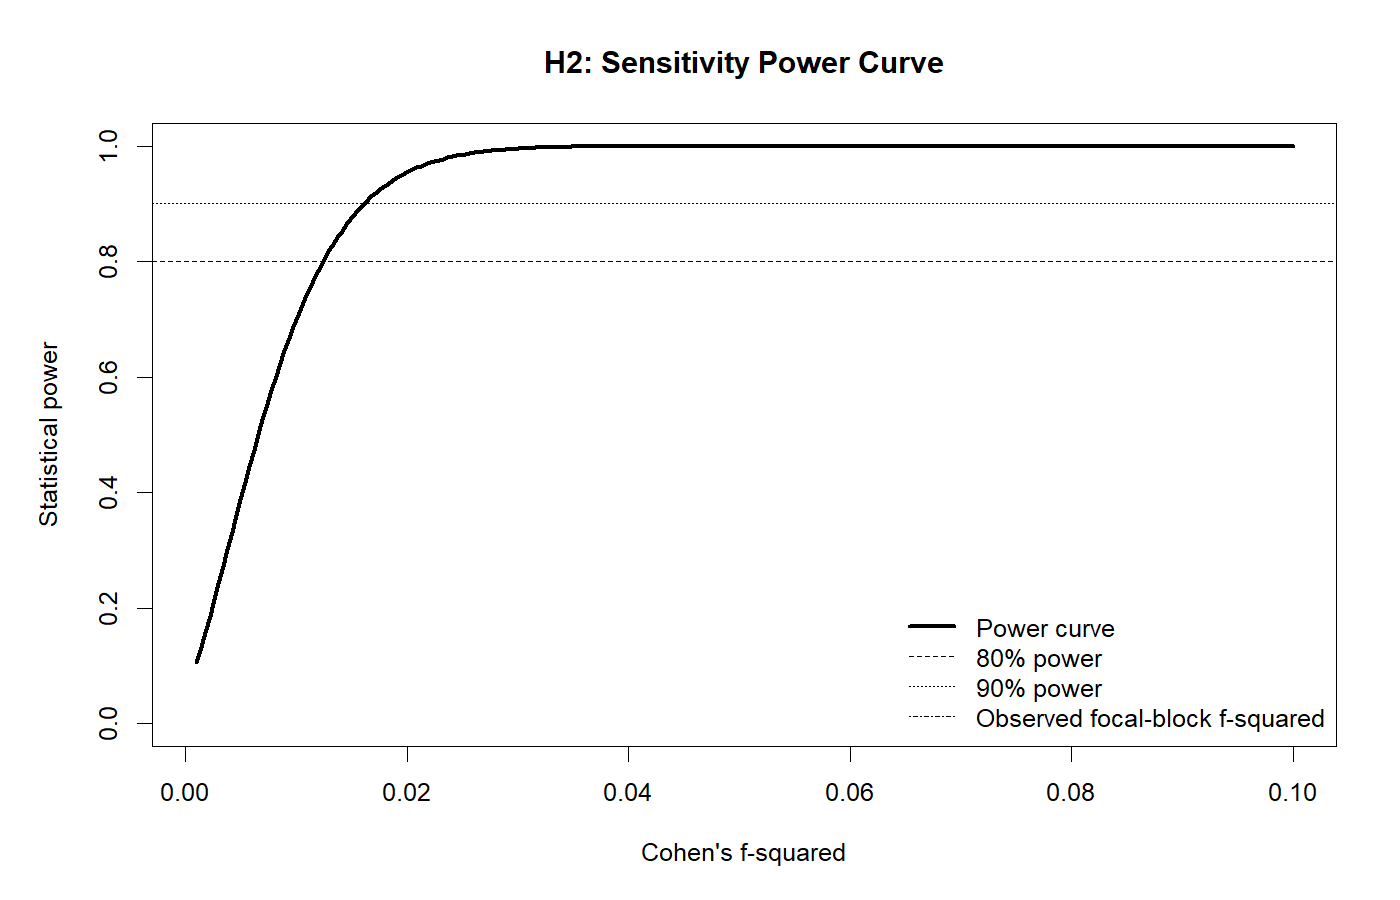
For Hypothesis 2, Research Self-Efficacy, Academic Belonging, and Structural Barrier Load formed the three-predictor focal block for Academic Research Engagement. With N = 891 and 12 total predictors, the focal block accounted for an additional ΔR² = .5163 beyond the covariates. The partial Cohen's f² was 1.1427, and the nested focal-block test was statistically significant, F = 334.444, p < .001. The sensitivity analysis showed minimum detectable f² values of .0124 at 80% power, .0161 at 90% power, and .0196 at 95% power.
Table 14
Power for prespecified focal-block effect sizes for Hypothesis 2
| Cohen f² | Statistical power |
|---|---|
| .01 | .6994 |
| .02 | .9545 |
| .05 | 1.0000 |
| .15 | 1.0000 |
For the Hypothesis 2 specification, power was .6994 for f² = .01 and .9545 for f² = .02. Power was essentially 1.00 for the larger prespecified effects of .05 and .15. Of the three models, this specification had the smallest 80% minimum detectable effect, f² = .0124.
Table 15
Future sample-size requirements for the Hypothesis 2 model specification
| Cohen f² | Required N at 80% power | Required N at 90% power |
|---|---|---|
| .01 | 1,104 | 1,431 |
| .02 | 559 | 722 |
| .05 | 231 | 297 |
| .15 | 86 | 108 |
Figure 11
Sensitivity power curve for Hypothesis 2
Power Findings for Hypothesis 3
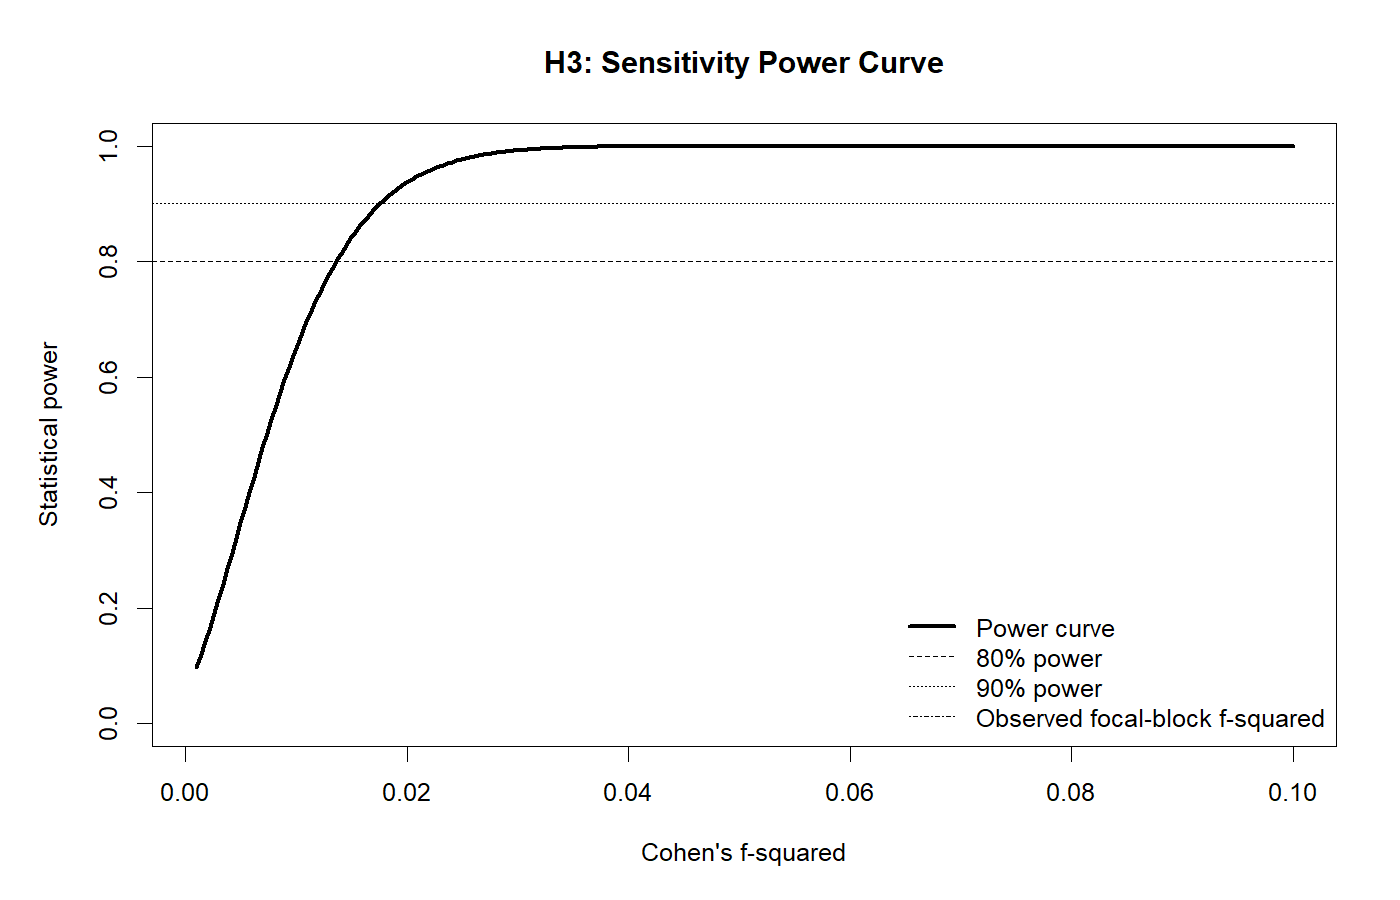
For Hypothesis 3, Academic Research Engagement, Graduate Research Burnout, Research Self-Efficacy, and Academic Belonging formed the four-predictor focal block for Persistence Intentions. With N = 891 and 13 total predictors, the focal block accounted for an additional ΔR² = .3991 beyond the covariates. The partial Cohen's f² was .6847, and the nested focal-block test was statistically significant, F = 150.117, p < .001. The sensitivity analysis showed minimum detectable f² values of .0136 at 80% power, .0176 at 90% power, and .0212 at 95% power.
Table 16
Power for prespecified focal-block effect sizes for Hypothesis 3
| Cohen f² | Statistical power |
|---|---|
| .01 | .6507 |
| .02 | .9370 |
| .05 | .9999 |
| .15 | 1.0000 |
For the Hypothesis 3 specification, power was .6507 for f² = .01 and .9370 for f² = .02. Power was .9999 for f² = .05 and 1.0000 for f² = .15. Thus, under the conventional fixed-predictor framework, the sample was highly sensitive to effects around f² = .02 or larger, whereas a very small effect of .01 would not have reached the usual 80% target.
Table 17
Future sample-size requirements for the Hypothesis 3 model specification
| Cohen f² | Required N at 80% power | Required N at 90% power |
|---|---|---|
| .01 | 1,208 | 1,555 |
| .02 | 611 | 785 |
| .05 | 253 | 322 |
| .15 | 94 | 117 |
Figure 12
Sensitivity power curve for Hypothesis 3
Practical Interpretation of the Sensitivity Results
Across the three regression specifications, the 80% minimum detectable focal-block effect ranged from f² = .0124 to .0136. For a prespecified f² = .02, power ranged from .9370 to .9545, whereas power for f² = .01 ranged from .6507 to .6994. These results indicate that, under the conventional assumptions, the analytic samples were well positioned to detect effects around .02 but were not large enough to guarantee 80% power for an effect as small as .01.
The future-study calculations further illustrate the design implications. To detect f² = .02 with 80% power, a future study using the same model structures would require approximately 559 to 611 observations; for 90% power, approximately 722 to 785 observations would be required. Detecting f² = .01 would require substantially larger samples: approximately 1,104 to 1,208 observations for 80% power and 1,431 to 1,555 observations for 90% power. In contrast, effects of f² = .05 or .15 could be detected with much smaller samples under the same fixed-predictor assumptions.
Because GREPS is synthetic and the represented design is cross-sectional and nonexperimental, the calculations should be interpreted as methodological demonstrations and planning illustrations rather than population claims. The observed focal-block f² values describe the synthetic dataset, whereas the sensitivity and future-study calculations provide the more useful design-oriented results of the power analysis.
Summary of Results and Power Findings
The results supported all three prespecified hypotheses in the synthetic GREPS case-study data. Mentoring quality, peer research support, and research resource adequacy were positively associated with research self-efficacy, whereas structural barrier load was negatively associated with self-efficacy. Research self-efficacy and academic belonging were positively associated with academic research engagement, while structural barrier load was negatively associated with engagement. Academic research engagement, research self-efficacy, and academic belonging were positively associated with persistence intentions, whereas graduate research burnout was negatively associated with persistence intentions. The three models explained 26.5%, 54.8%, and 41.7% of the variance in their respective outcomes. Residual normality was reasonably acceptable across the models. Homoscedasticity appeared reasonable for the first two models but was questionable for the persistence-intentions model.
The R sensitivity analysis provided an additional design-oriented perspective. The focal predictor blocks added ΔR² values of .2323, .5163, and .3991, corresponding to partial f² values of .3158, 1.1427, and .6847. At 80% power, the minimum detectable focal-block effect ranged from f² = .0124 to .0136, while power for a prespecified f² = .02 ranged from .9370 to .9545. For future study planning, detection of f² = .02 would require approximately 559 to 611 observations for 80% power or 722 to 785 observations for 90% power. These calculations describe sensitivity rather than retrospective evidence of significance and do not account for the 15-institution clustering. Because GREPS is synthetic and cross-sectional, the findings remain methodological demonstrations rather than causal or population-level evidence.
Discuss your research
Share a non-confidential summary of the quantitative decision, design, and evidence you are working with.