
Moderation Analysis – Conditional effects, robust inference, and hypothesis testing
Synthetic methodological demonstration
Created from scratch with synthetic data and reconstructed context. No client data or original client document is used.
Analysis Plan
Three prespecified moderation hypotheses were evaluated in the synthetic Graduate Research Engagement and Persistence Study (GREPS). IBM SPSS Statistics was used to perform composite scoring, regression diagnostics, and the moderation analyses. The moderation models were estimated with Andrew F. Hayes's PROCESS macro using Model 1, the regression-based simple moderation model described by Hayes (2022) and Hayes and Rockwood (2017).
Hypothesis 1 (H1) predicted that mentoring quality would buffer the negative association between structural barrier load and research self-efficacy. Specifically, the negative association of structural barrier load with research self-efficacy was expected to become weaker as mentoring quality increased. Hypothesis 2 (H2) predicted that academic belonging would buffer the negative association between structural barrier load and academic research engagement, such that the negative barrier-engagement association would become weaker at higher levels of belonging. Hypothesis 3 (H3) predicted that graduate research burnout would weaken the positive association between academic research engagement and persistence intentions, such that the engagement-persistence association would become smaller as burnout increased.
Each model included adjustments for degree type, enrollment status, instruction modality, completed graduate methods/statistics courses, weekly paid-work hours outside the research role, first-generation status, international-student status, and caregiving responsibilities. Degree type, enrollment status, and instruction modality were dummy coded, with master's, full-time, and primarily in-person students serving as the respective reference groups. The analysis for H1 included 900 cases. The analyses for H2 and H3 each included 891 cases because nine records were missing the complete academic research engagement score.
Moderation Analysis Strategy
The primary moderation analyses were conducted using PROCESS Model 1. Before constructing the interaction term, the continuous focal variables were mean centered. Each model included the focal predictor, the moderator, their product term, and the prespecified covariates. The interaction coefficient served as the primary statistical test of moderation. HC3 heteroskedasticity-consistent standard errors and 95% confidence intervals were used for the primary models, providing inference that is less dependent on constant residual variance (Long & Ervin, 2000).
For interpretation of an interaction, the conditional effect of the focal predictor was examined at approximately one standard deviation below the moderator mean, at the mean, and one standard deviation above the mean. A Johnson-Neyman analysis was also requested to determine the moderator values at which the conditional focal-predictor effect crossed the conventional significance boundary. PROCESS plotting data were requested to provide a graphical presentation of the interactions.
Because the students were nested within 15 anonymous institutions, each primary model was repeated using institution-clustered standard errors as a sensitivity analysis. The clustered models did not replace the prespecified HC3 primary tests; rather, they were used to determine whether the substantive conclusions were sensitive to within-institution dependence. Given that only 15 clusters were available, the cluster-robust results were interpreted cautiously, consistent with general recommendations for clustered inference (Cameron & Miller, 2015).
Assumption Testing
Before interpreting the moderation results, diagnostic OLS regressions corresponding to the three moderation specifications were examined. Residual normality was assessed using histograms and Normal P-P plots of standardized residuals. Linearity and variance constancy were assessed using scatterplots of standardized residuals against standardized predicted values. Standardized residuals and PROCESS influence diagnostics were examined for unusually influential observations, while tolerance and variance inflation factor (VIF) statistics were used to evaluate multicollinearity.
The PROCESS diagnostics also reported residual skewness and kurtosis, Bonferroni-corrected tests for the largest studentized residual, and normal and robust Breusch-Pagan tests of heteroskedasticity. Because HC3 standard errors were prespecified for the primary models, evidence of heteroskedasticity did not require replacement of the primary model; instead, it provided information relevant to the need for robust inference. A broad descriptive-statistics section and a post hoc power analysis were not included.
Hypothesis Decision Rules
The decision regarding support for each hypothesis was based primarily on the sign, 95% confidence interval, and p-value of the focal interaction coefficient in the HC3 PROCESS model. A hypothesis was considered supported when the interaction was statistically significant at the .05 level and the sign was consistent with the prespecified direction. Conditional effects and Johnson-Neyman results were then used to describe the form of a supported interaction. The institution-clustered model was considered sensitivity evidence and was not used as the primary decision rule.
Synthetic-data disclosure: GREPS is a synthetic case-study dataset. No real individuals were recruited, surveyed, or observed. Accordingly, the results demonstrate statistical methodology and should not be interpreted as empirical evidence concerning real graduate students or universities.
Findings
Moderation Model 1: Research Self-Efficacy
Assessment of the Assumptions of Moderation Model 1
The residual histogram for the research self-efficacy model was approximately symmetric, while the Normal P-P plot closely followed the diagonal reference line. Standardized residuals ranged from -2.895 to 2.865; therefore, no observation exceeded an absolute standardized residual of 3 in the diagnostic OLS model. The PROCESS diagnostics similarly showed modest residual skewness (-.118) and kurtosis (-.464), with a Bonferroni-corrected p-value of 1.000 for the largest studentized residual.
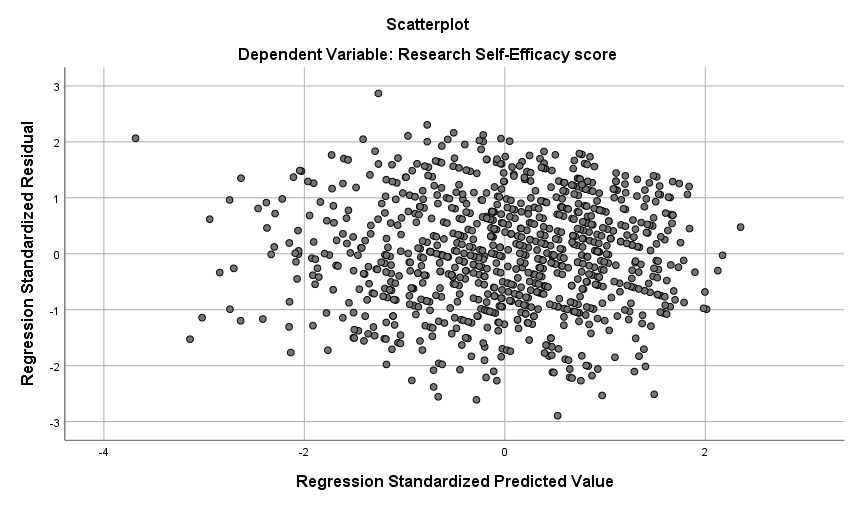
The scatterplot of residuals against predicted values showed no pronounced funnel or systematic curvature. The results of the PROCESS Breusch-Pagan tests were nonsignificant for both the normal test, chi-square(12) = 6.346, p = .898, and the robust test, chi-square(12) = 8.284, p = .763. VIF values ranged from approximately 1.01 to 1.25. Taken together, the diagnostic results did not indicate a material violation of residual normality, linearity, homoscedasticity, or multicollinearity for Moderation Model 1.
Figure 1
Histogram of standardized residuals for the research self-efficacy moderation model
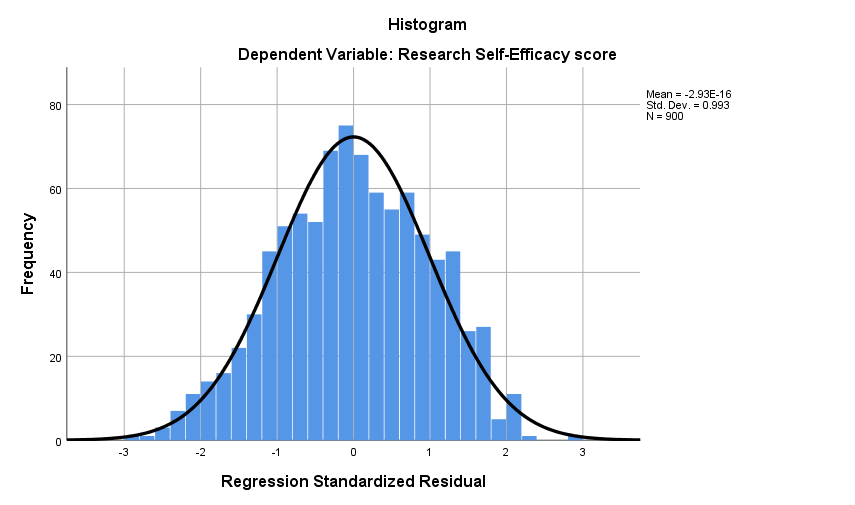
Figure 2
Normal P-P plot of standardized residuals for the research self-efficacy moderation model
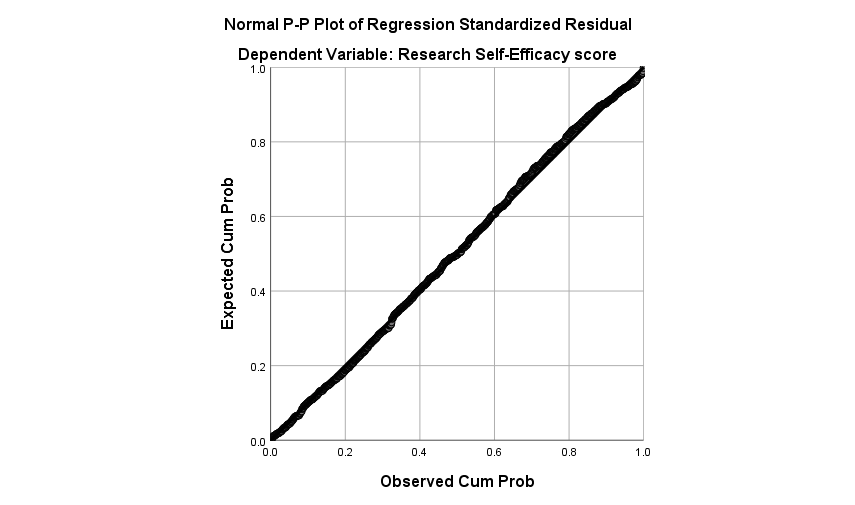
Figure 3
Standardized residuals against standardized predicted values for the research self-efficacy moderation model
Results of Moderation Model 1
The results of the HC3 PROCESS analysis showed that the model predicting research self-efficacy was statistically significant, R = .475, R Square = .226, F(12, 887) = 22.642, p < .001, with MSE = 1.234. Structural barrier load had a significant negative association with research self-efficacy (B = -.190, HC3 SE = .045, p < .001), whereas mentoring quality had a significant positive association with research self-efficacy (B = .380, HC3 SE = .029, p < .001). Completed graduate methods/statistics courses was also positively associated with research self-efficacy (B = .141, p < .001). The remaining covariates were not statistically significant at the .05 level.
The interaction between Structural Barrier Load x Mentoring Quality was positive but was not statistically significant at the prespecified .05 level in the primary HC3 model, B = .063, HC3 SE = .033, t = 1.884, p = .060, 95% CI [-.003, .128]. The interaction explained an additional Delta R Square = .0035. Thus, although the direction of the coefficient was consistent with a buffering effect, the primary model did not provide sufficient evidence of moderation at the .05 level.
Table 1
Model summary for Moderation Model 1 predicting research self-efficacy
| R | R Square | F(HC3) | df | p-value |
|---|---|---|---|---|
| .4753 | .2259 | 22.6419 | 12, 887 | < .001 |
Table 2
HC3 parameter estimates for Moderation Model 1 predicting research self-efficacy
| Unstandardized Coefficients | 95% CI | ||||
|---|---|---|---|---|---|
| Predictor | B | HC3 SE | t | p-value | LLCI, ULCI |
| Constant | 4.4254 | .1018 | 43.463 | < .001 | [4.2256, 4.6253] |
| Structural Barrier Load | -.1898 | .0445 | -4.270 | < .001 | [-.2770, -.1025] |
| Mentoring Quality | .3801 | .0289 | 13.167 | < .001 | [.3234, .4368] |
| Barrier Load x Mentoring Quality | .0627 | .0333 | 1.884 | .060 | [-.0026, .1280] |
| Research doctorate/PhD (vs. master's) | .0179 | .0785 | .229 | .819 | [-.1361, .1720] |
| Part-time (vs. full-time) | -.0625 | .0964 | -.649 | .517 | [-.2518, .1267] |
| Hybrid (vs. primarily in-person) | -.0588 | .0840 | -.700 | .484 | [-.2236, .1060] |
| Primarily online (vs. primarily in-person) | -.0761 | .1158 | -.657 | .511 | [-.3033, .1511] |
| Completed methods/statistics courses | .1409 | .0298 | 4.730 | < .001 | [.0825, .1994] |
| Weekly paid-work hours | .0007 | .0033 | .200 | .842 | [-.0057, .0070] |
| First-generation student | -.1278 | .0791 | -1.617 | .106 | [-.2830, .0273] |
| International student | -.1577 | .0918 | -1.718 | .086 | [-.3378, .0224] |
| Caregiving responsibilities | -.0208 | .0864 | -.241 | .810 | [-.1905, .1488] |
Note. HC3 = heteroskedasticity-consistent standard error estimator. SPSS values displayed as .0000 are reported as p < .001. The reference categories were master's, full-time, primarily in-person, non-first-generation, non-international, and no caregiving responsibilities, as applicable.
Table 3
Conditional effect of structural barrier load on research self-efficacy at selected levels of mentoring quality
| Mentoring Quality | Effect | HC3 SE | t | p-value | 95% CI |
|---|---|---|---|---|---|
| -1 SD | -.2722 | .0629 | -4.330 | < .001 | [-.3956, -.1488] |
| Mean | -.1898 | .0445 | -4.270 | < .001 | [-.2770, -.1025] |
| +1 SD | -.1073 | .0619 | -1.735 | .083 | [-.2288, .0141] |
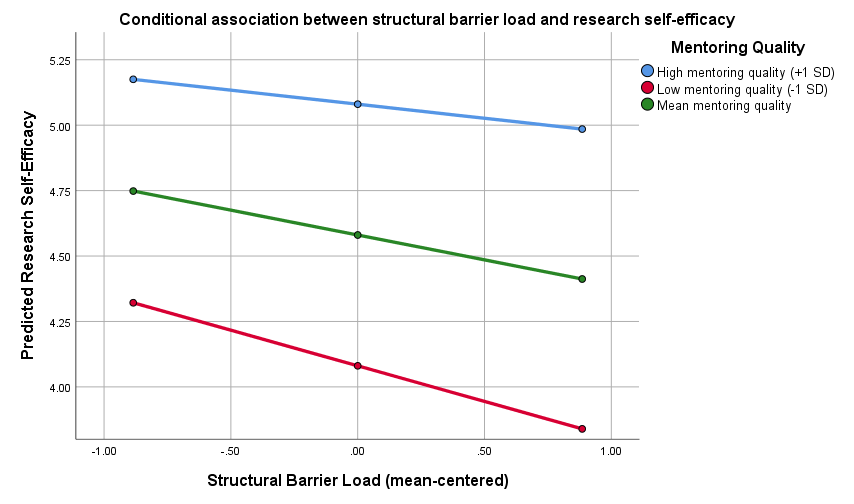
The conditional-effect results showed a significant negative association between structural barrier load and research self-efficacy at low mentoring quality and at the mean; however, the association was not statistically significant at one standard deviation above the mentoring-quality mean. The Johnson-Neyman analysis identified a centered mentoring-quality value of 1.183 as the transition point, with approximately 78.1% of cases falling below this value. Although this pattern was substantively consistent with buffering, the overall HC3 interaction test was p = .060; therefore, the conditional pattern was interpreted descriptively rather than as confirmation of H1.
Figure 4
Conditional association between structural barrier load and research self-efficacy at selected levels of mentoring quality
Hypothesis 1
The results did not provide support for Hypothesis 1 in the prespecified primary analysis. The Structural Barrier Load x Mentoring Quality coefficient was positive, as hypothesized, but the HC3 p-value was .060 and the 95% confidence interval included zero. The institution-clustered sensitivity model yielded a marginally significant interaction (B = .063, p = .049); however, this sensitivity result did not replace the primary HC3 decision rule.
Moderation Model 2: Academic Research Engagement
Assessment of the Assumptions of Moderation Model 2
The residual histogram for academic research engagement was approximately bell-shaped, and the Normal P-P plot closely followed the diagonal reference line. Standardized residuals ranged from -3.208 to 3.038 in the diagnostic OLS model, with two observations slightly exceeding an absolute value of 3. The PROCESS diagnostics reported residual skewness of -.139 and kurtosis of -.141. The Bonferroni-corrected p-value for the largest studentized residual was 1.000, indicating that no individual residual was extreme after correction.
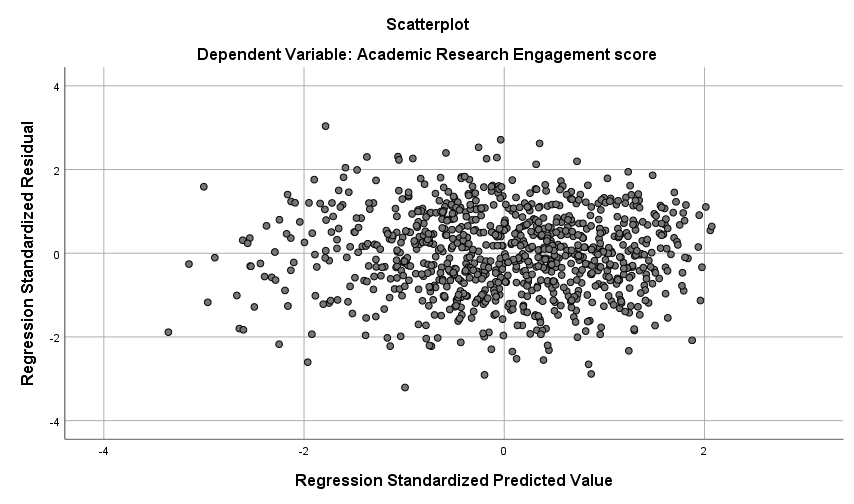
The scatterplot of residuals against predicted values showed no pronounced funnel or systematic curvature. Both the normal Breusch-Pagan test, chi-square(12) = 11.729, p = .468, and the robust Breusch-Pagan test, chi-square(12) = 12.661, p = .394, were nonsignificant. VIF values ranged from approximately 1.01 to 1.24. Therefore, the diagnostic evidence indicated that the regression assumptions were reasonably satisfied for Moderation Model 2.
Figure 5
Histogram of standardized residuals for the academic research engagement moderation model
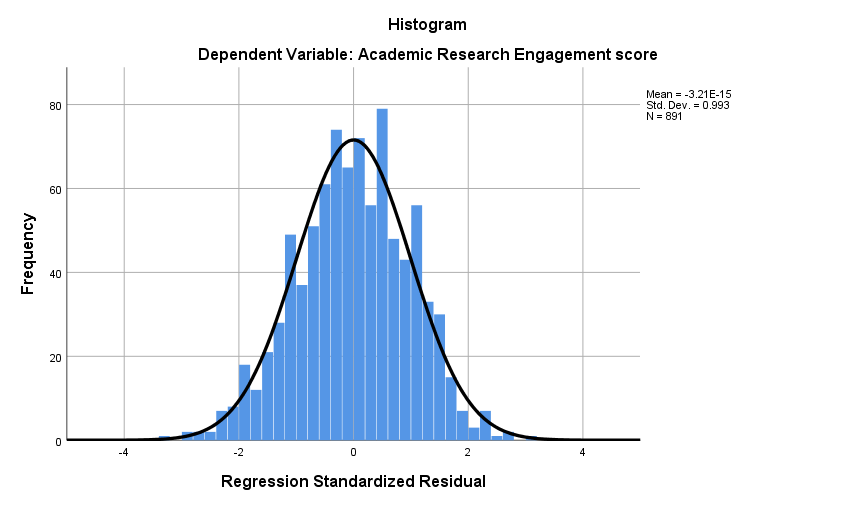
Figure 6
Normal P-P plot of standardized residuals for the academic research engagement moderation model
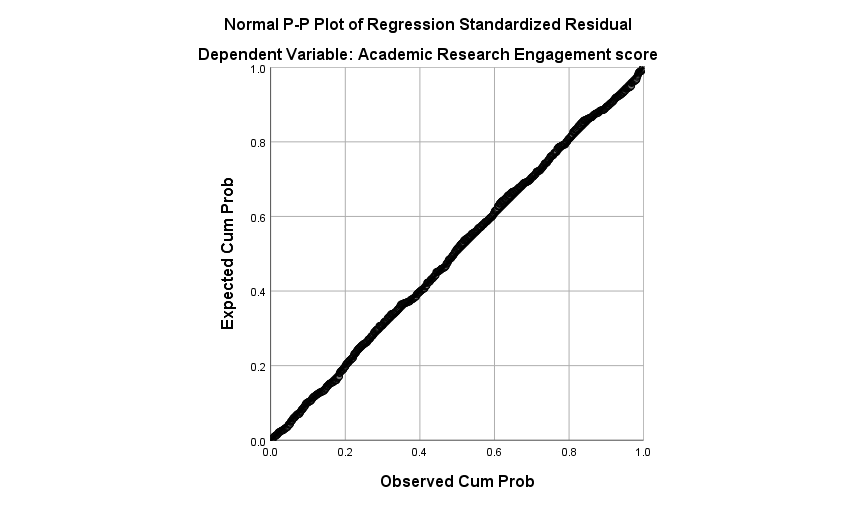
Figure 7
Standardized residuals against standardized predicted values for the academic research engagement moderation model
Results of Moderation Model 2
The results of the HC3 PROCESS analysis showed that the model predicting academic research engagement was statistically significant, R = .611, R Square = .373, F(12, 878) = 42.307, p < .001, with MSE = .629. Structural barrier load was significantly and negatively associated with engagement (B = -.237, HC3 SE = .033, p < .001), whereas academic belonging was significantly and positively associated with engagement (B = .397, HC3 SE = .022, p < .001). Part-time enrollment was associated with lower engagement relative to full-time enrollment (B = -.155, p = .027), and completed methods/statistics courses was positively associated with engagement (B = .041, p = .037).
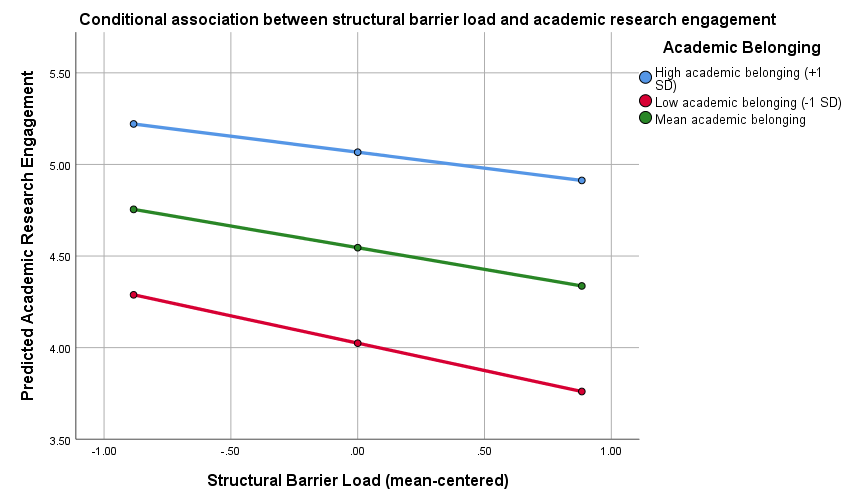
The Structural Barrier Load x Academic Belonging interaction was positive and statistically significant, B = .047, HC3 SE = .023, t = 2.051, p = .041, 95% CI [.002, .093]. The interaction accounted for an additional Delta R Square = .0032. This positive interaction indicated that the negative association between structural barrier load and engagement became weaker as academic belonging increased.
Table 4
Model summary for Moderation Model 2 predicting academic research engagement
| R | R Square | F(HC3) | df | p-value |
|---|---|---|---|---|
| .6111 | .3734 | 42.3065 | 12, 878 | < .001 |
Table 5
HC3 parameter estimates for Moderation Model 2 predicting academic research engagement
| Unstandardized Coefficients | 95% CI | ||||
|---|---|---|---|---|---|
| Predictor | B | HC3 SE | t | p-value | LLCI, ULCI |
| Constant | 4.4701 | .0747 | 59.829 | < .001 | [4.3235, 4.6168] |
| Structural Barrier Load | -.2366 | .0327 | -7.230 | < .001 | [-.3008, -.1724] |
| Academic Belonging | .3974 | .0216 | 18.398 | < .001 | [.3550, .4398] |
| Barrier Load x Academic Belonging | .0474 | .0231 | 2.051 | .041 | [.0020, .0927] |
| Research doctorate/PhD (vs. master's) | .0231 | .0563 | .410 | .682 | [-.0874, .1335] |
| Part-time (vs. full-time) | -.1546 | .0696 | -2.221 | .027 | [-.2912, -.0180] |
| Hybrid (vs. primarily in-person) | .0670 | .0613 | 1.094 | .274 | [-.0532, .1873] |
| Primarily online (vs. primarily in-person) | -.0459 | .0806 | -.569 | .569 | [-.2040, .1123] |
| Completed methods/statistics courses | .0405 | .0194 | 2.087 | .037 | [.0024, .0785] |
| Weekly paid-work hours | .0007 | .0023 | .325 | .745 | [-.0037, .0052] |
| First-generation student | -.0044 | .0571 | -.077 | .939 | [-.1165, .1077] |
| International student | .0341 | .0679 | .502 | .616 | [-.0993, .1674] |
| Caregiving responsibilities | -.0343 | .0641 | -.535 | .593 | [-.1600, .0915] |
Note. HC3 = heteroskedasticity-consistent standard error estimator. SPSS values displayed as .0000 are reported as p < .001. The reference categories were master's, full-time, primarily in-person, non-first-generation, non-international, and no caregiving responsibilities, as applicable.
Table 6
Conditional effect of structural barrier load on academic research engagement at selected levels of academic belonging
| Academic Belonging | Effect | HC3 SE | t | p-value | 95% CI |
|---|---|---|---|---|---|
| -1 SD | -.2987 | .0456 | -6.547 | < .001 | [-.3883, -.2092] |
| Mean | -.2366 | .0327 | -7.230 | < .001 | [-.3008, -.1724] |
| +1 SD | -.1745 | .0435 | -4.007 | < .001 | [-.2599, -.0890] |
The conditional effects were negative and statistically significant at low, mean, and high levels of academic belonging; however, the magnitude of the effects decreased as belonging increased. The Johnson-Neyman analysis identified a transition point at a centered belonging value of 2.390, which was above approximately 97.2% of observations. Thus, the structural-barrier effect became nonsignificant only at very high levels of belonging near the upper end of the observed moderator distribution.
Figure 8
Conditional association between structural barrier load and academic research engagement at selected levels of academic belonging
Hypothesis 2
The results provided support for Hypothesis 2. The Structural Barrier Load x Academic Belonging interaction was positive and statistically significant in the primary HC3 model (B = .047, p = .041), consistent with the prediction that academic belonging buffers the negative association between structural barriers and research engagement. The institution-clustered sensitivity model also yielded a significant positive interaction (B = .047, p = .014), providing additional evidence for the robustness of this conclusion.
Moderation Model 3: Persistence Intentions
Assessment of the Assumptions of Moderation Model 3
The residual histogram for persistence intentions was broadly bell-shaped, although a modest negative tail was evident, and the Normal P-P plot remained close to the diagonal through most of the distribution. Standardized residuals ranged from -3.093 to 2.670, with one observation slightly below -3. The PROCESS diagnostics reported residual skewness of -.298 and kurtosis of -.173, and the Bonferroni-corrected p-value for the largest studentized residual was 1.000. VIF values ranged from approximately 1.01 to 1.43, indicating that multicollinearity was not problematic.
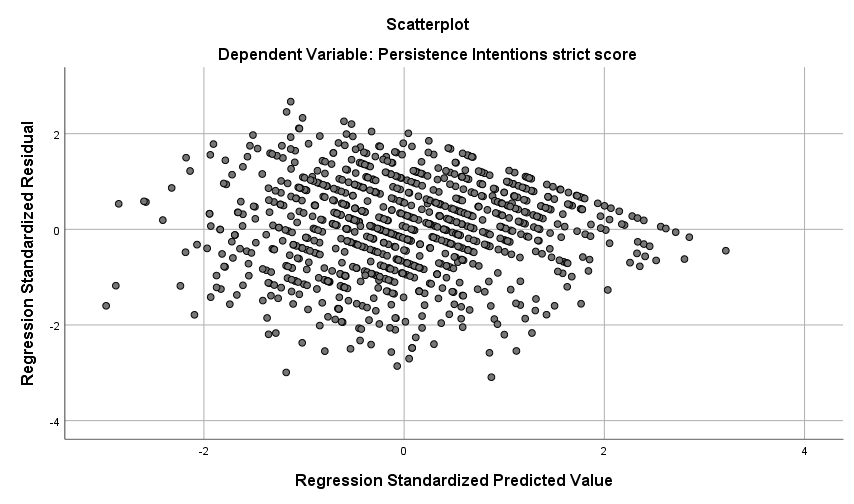
In contrast to the first two models, the scatterplot of residuals against predicted values showed a noticeable change in residual dispersion across fitted values. The Breusch-Pagan tests indicated significant heteroskedasticity for both the normal test, chi-square(12) = 35.881, p < .001, and the robust test, chi-square(12) = 39.403, p < .001. Therefore, conventional homoscedastic OLS standard errors were not appropriate for the primary inference. Because the prespecified HC3 estimator directly addressed this issue, the moderation model remained interpretable using the robust HC3 results.
Figure 9
Histogram of standardized residuals for the persistence-intentions moderation model
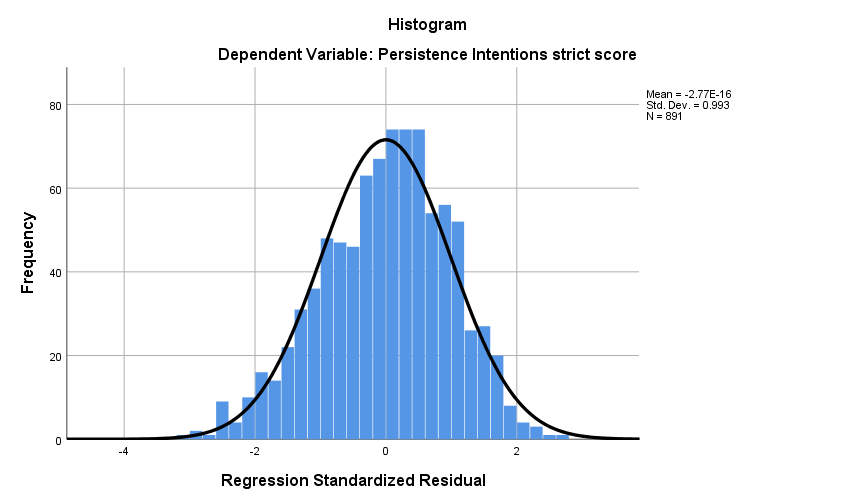
Figure 10
Normal P-P plot of standardized residuals for the persistence-intentions moderation model
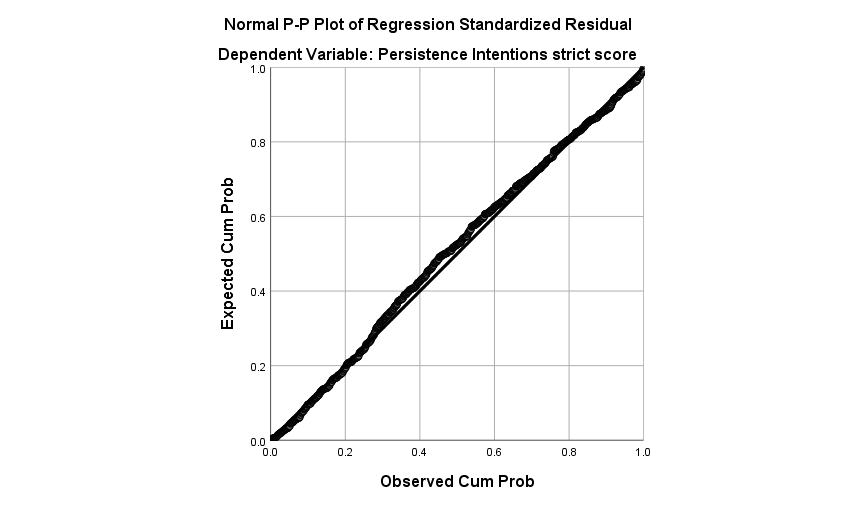
Figure 11
Standardized residuals against standardized predicted values for the persistence-intentions moderation model
Results of Moderation Model 3
The results of the HC3 PROCESS analysis showed that the model predicting persistence intentions was statistically significant, R = .615, R Square = .378, F(12, 878) = 57.759, p < .001, with MSE = 1.019. Academic research engagement was significantly and positively associated with persistence intentions (B = .535, HC3 SE = .042, p < .001), whereas graduate research burnout was significantly and negatively associated with persistence intentions (B = -.367, HC3 SE = .043, p < .001). None of the prespecified covariates was statistically significant at the .05 level in the primary HC3 model.
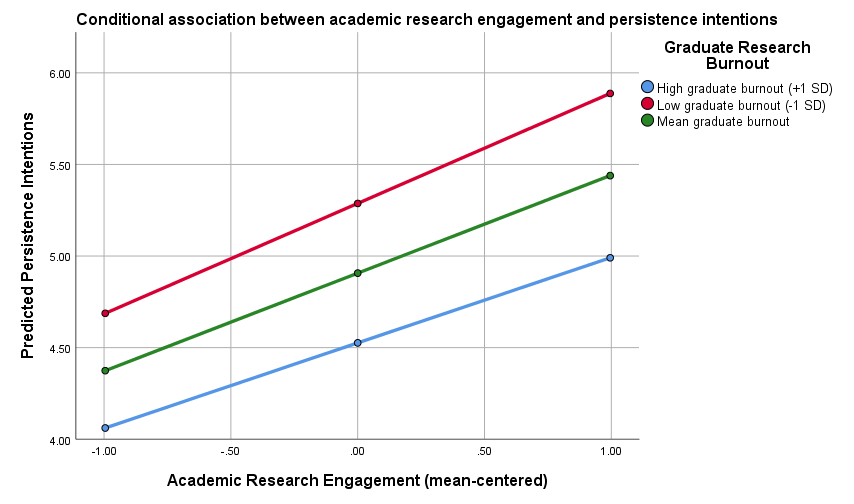
The Academic Research Engagement x Graduate Research Burnout interaction was negative and statistically significant, B = -.066, HC3 SE = .028, t = -2.325, p = .020, 95% CI [-.121, -.010]. The interaction explained an additional Delta R Square = .0040. The negative coefficient indicated that the positive association between engagement and persistence intentions became weaker as burnout increased.
Table 7
Model summary for Moderation Model 3 predicting persistence intentions
| R | R Square | F(HC3) | df | p-value |
|---|---|---|---|---|
| .6148 | .3780 | 57.7589 | 12, 878 | < .001 |
Table 8
HC3 parameter estimates for Moderation Model 3 predicting persistence intentions
| Unstandardized Coefficients | 95% CI | ||||
|---|---|---|---|---|---|
| Predictor | B | HC3 SE | t | p-value | LLCI, ULCI |
| Constant | 4.9522 | .0967 | 51.213 | < .001 | [4.7624, 5.1420] |
| Academic Research Engagement | .5348 | .0415 | 12.875 | < .001 | [.4533, .6164] |
| Graduate Research Burnout | -.3668 | .0434 | -8.456 | < .001 | [-.4520, -.2817] |
| Engagement x Burnout | -.0657 | .0282 | -2.325 | .020 | [-.1211, -.0102] |
| Research doctorate/PhD (vs. master's) | -.0690 | .0717 | -.962 | .336 | [-.2097, .0718] |
| Part-time (vs. full-time) | .0497 | .0926 | .537 | .592 | [-.1321, .2314] |
| Hybrid (vs. primarily in-person) | -.0737 | .0785 | -.939 | .348 | [-.2277, .0803] |
| Primarily online (vs. primarily in-person) | -.0045 | .0996 | -.045 | .964 | [-.1999, .1909] |
| Completed methods/statistics courses | -.0090 | .0270 | -.333 | .739 | [-.0620, .0440] |
| Weekly paid-work hours | .0002 | .0030 | .056 | .955 | [-.0058, .0061] |
| First-generation student | .0081 | .0710 | .114 | .909 | [-.1313, .1475] |
| International student | -.0570 | .0894 | -.638 | .524 | [-.2325, .1185] |
| Caregiving responsibilities | .1184 | .0769 | 1.541 | .124 | [-.0324, .2693] |
Note. HC3 = heteroskedasticity-consistent standard error estimator. SPSS values displayed as .0000 are reported as p < .001. The reference categories were master's, full-time, primarily in-person, non-first-generation, non-international, and no caregiving responsibilities, as applicable.
Table 9
Conditional effect of academic research engagement on persistence intentions at selected levels of graduate research burnout
| Graduate Research Burnout | Effect | HC3 SE | t | p-value | 95% CI |
|---|---|---|---|---|---|
| -1 SD | .6030 | .0494 | 12.212 | < .001 | [.5061, .6999] |
| Mean | .5348 | .0415 | 12.875 | < .001 | [.4533, .6164] |
| +1 SD | .4667 | .0523 | 8.929 | < .001 | [.3641, .5693] |
The conditional effect of engagement remained positive and statistically significant at low, mean, and high levels of burnout, although its magnitude decreased as burnout increased. The PROCESS analysis identified no Johnson-Neyman significance transition point within the observed burnout range. Thus, engagement remained significantly and positively associated with persistence intentions throughout the observed range, even though the strength of this association was attenuated at higher levels of burnout.
Figure 12
Conditional association between academic research engagement and persistence intentions at selected levels of graduate research burnout
Hypothesis 3
The results provided support for Hypothesis 3. The Academic Research Engagement x Graduate Research Burnout interaction was negative and statistically significant in the primary HC3 model (B = -.066, p = .020), indicating that the positive association between engagement and persistence intentions weakened as burnout increased. The institution-clustered sensitivity model also yielded a significant negative interaction (B = -.066, p = .004), providing additional support for the primary conclusion.
Institution-Clustered Sensitivity Analysis
The institution-clustered sensitivity analyses were based on 15 clusters. For H1, the interaction was positive, B = .063, with cluster-robust SE = .029, t(14) = 2.157, p = .049, 95% CI [.0004, .1251]. For H2, the interaction was positive, B = .047, with cluster-robust SE = .017, t(14) = 2.821, p = .014, 95% CI [.0114, .0834]. For H3, the interaction was negative, B = -.066, with cluster-robust SE = .019, t(14) = -3.395, p = .004, 95% CI [-.1071, -.0242].
The clustered analyses strengthened the statistical evidence for H2 and H3 and produced a just-significant result for H1. However, the HC3 model was prespecified as the primary inferential test, and only 15 institutions were available for cluster-robust inference. Therefore, the primary hypothesis decisions were retained: H1 was not supported, whereas H2 and H3 were supported.
Table 10
Institution-clustered sensitivity results for the three focal interactions
| Hypothesis | Interaction B | SE(CR) | t(14) | p-value | 95% CI |
|---|---|---|---|---|---|
| H1: Barrier Load x Mentoring | .0627 | .0291 | 2.157 | .049 | [.0004, .1251] |
| H2: Barrier Load x Belonging | .0474 | .0168 | 2.821 | .014 | [.0114, .0834] |
| H3: Engagement x Burnout | -.0657 | .0193 | -3.395 | .004 | [-.1071, -.0242] |
Note. CR = institution-clustered robust standard error. Cluster-based t tests used 14 denominator degrees of freedom because 15 institutions were represented.
Summary
Three moderation hypotheses were evaluated using regression-based PROCESS Model 1 analyses with HC3 heteroskedasticity-consistent standard errors. The first model examined whether mentoring quality buffered the negative association between structural barrier load and research self-efficacy. The interaction coefficient was positive but did not reach the prespecified .05 significance level in the primary HC3 model (B = .063, p = .060). Therefore, H1 was not supported, although the conditional-effect pattern and the clustered sensitivity result were consistent with the proposed buffering direction.
The results of the second model showed that academic belonging significantly moderated the association between structural barrier load and academic research engagement (B = .047, p = .041). Structural barriers were negatively associated with engagement across the probed levels of belonging, but the magnitude of this negative association decreased as belonging increased. These results supported H2, and the interaction remained statistically significant in the institution-clustered sensitivity analysis.
The results of the third model showed that graduate research burnout significantly moderated the association between academic research engagement and persistence intentions (B = -.066, p = .020). Academic research engagement remained positively associated with persistence intentions throughout the observed burnout range; however, the magnitude of this positive association decreased as burnout increased. These results supported H3 and remained robust under institution-clustered inference.
The diagnostic findings were generally favorable for Moderation Models 1 and 2. Moderation Model 3 showed statistically significant heteroskedasticity; however, the prespecified HC3 robust standard errors addressed this issue. VIF values were low across all three models, and the residual and influence diagnostics did not indicate a pervasive problem with extreme or highly influential observations. Overall, the primary analyses provided evidence of moderation by academic belonging and graduate research burnout, but did not provide definitive primary evidence of moderation by mentoring quality.
Because GREPS is synthetic and uses a cross-sectional, nonexperimental design, the findings should be interpreted as demonstrations of conditional associations rather than as causal moderation effects in a real population.
References
Hayes, A. F. (2022). Introduction to Mediation, Moderation, and Conditional Process Analysis: A Regression-Based Approach (3rd ed.). Guilford Press.
Hayes, A. F., & Rockwood, N. J. (2017). Regression-based statistical mediation and moderation analysis in clinical research: Observations, recommendations, and implementation. Behaviour Research and Therapy, 98, 39-57.
Long, J. S., & Ervin, L. H. (2000). Using heteroscedasticity consistent standard errors in the linear regression model. The American Statistician, 54(3), 217-224.
Cameron, A. C., & Miller, D. L. (2015). A practitioner's guide to cluster-robust inference. Journal of Human Resources, 50(2), 317-372.
Need help with a similar research question?
Share a short, non-confidential summary of your study and the decision you need to make.