
Developing and Refining a Multi-Item Psychological Scale
Synthetic methodological demonstration
Created from scratch with synthetic data and reconstructed context. No client data or original client document is used.
Analysis Plan
Reliability analysis and exploratory factor analysis (EFA) were conducted to examine and refine the internal structure of the reflective multi-item measures in the synthetic Graduate Research Engagement and Persistence Study (GREPS) dataset. The purpose of the case study was measurement development rather than hypothesis testing; therefore, no research hypotheses were evaluated. The analyses examined whether the items formed interpretable and internally consistent dimensions and identified items that could weaken a proposed scale because of low item-total relationships, weak factor loadings, low communalities, or substantial cross-loadings.
The initial item pool consisted of 50 reflective indicators representing mentoring quality, peer research support, research self-efficacy, academic belonging, research vigor, research dedication, research absorption, research exhaustion, research cynicism, cognitive weariness, and persistence intentions. Research resource adequacy and structural barrier load were excluded because they were specified as formative measures, for which internal-consistency reliability and reflective EFA were not appropriate primary evaluation procedures. The analyses were conducted sequentially so that the item-level reliability and factor-analytic evidence could be considered together rather than applying any single statistical cutoff as an automatic item-deletion rule (Fabrigar et al., 1999; Worthington & Whittaker, 2006).
Data Preparation and Analytic Sample
The exploratory analyses included only cases assigned to the prespecified EFA development sample (efa_cfa_split = 1). The holdout sample was not used to determine exploratory item-retention decisions. Before conducting the reliability analysis or EFA, the five negatively worded items (MQ6, BEL5, CYN4, CW4, and PI5) were reverse-coded on the 1-to-7 response scale as 8 minus the original response and stored as new variables. The original item columns remained unchanged.
Because the GREPS reflective items used seven ordered response categories, an auxiliary R discovery analysis was conducted before the final SPSS workflow. This analysis examined polychoric correlations, parallel analysis, and sensitivity to alternative extraction and rotation specifications and was used to inform factor-retention and item-review decisions. The final reportable reliability coefficients, KMO and Bartlett statistics, communalities, and factor solutions were subsequently re-estimated in IBM SPSS Statistics using the prespecified EFA development sample.
Reliability and Item Analysis
The first stage of the scale evaluation examined the internal consistency of each proposed reflective dimension separately. Cronbach's alpha was calculated together with corrected item-total correlations, inter-item correlations, and Cronbach's alpha if an item was deleted. Alpha values near or above .70 were considered evidence of acceptable internal consistency for a developing scale, whereas corrected item-total correlations below approximately .30 were treated as indicators for closer review rather than as automatic deletion criteria (Cronbach, 1951; Worthington & Whittaker, 2006).
The initial reliability analysis was used as a diagnostic rather than a final evaluation. Items were not removed solely because deletion increased alpha. Instead, item wording, substantive coverage, corrected item-total correlations, and item behavior in the EFA were considered together. Reliability was then re-estimated after selection of the final item set.
Exploratory Factor Analysis
Before extracting the factors, the suitability of the item correlations for EFA was evaluated using the Kaiser-Meyer-Olkin (KMO) measure of sampling adequacy and Bartlett's test of sphericity. Item-level measures of sampling adequacy from the anti-image correlation matrix were also available for examination. A statistically significant Bartlett test and a sufficiently large KMO were required before interpretation of the factor solution (Bartlett, 1954; Kaiser, 1970).
Common factors were extracted using Principal Axis Factoring rather than principal components analysis because the objective was to identify latent common dimensions underlying the reflective item responses. Direct Oblimin rotation with delta equal to 0 and Kaiser normalization was applied because the proposed psychological dimensions were expected to be correlated. Accordingly, the SPSS output included the pattern matrix, structure matrix, and factor correlation matrix.
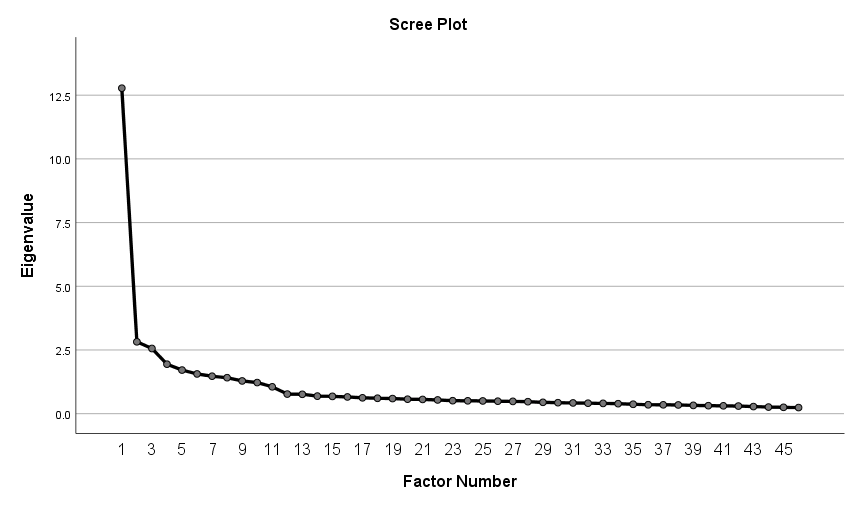
The number of factors was not determined solely by the eigenvalue-greater-than-one rule. Factor retention was evaluated using the parallel analysis from the auxiliary ordinal-data discovery stage, the scree plot, initial eigenvalues, the theoretical organization of the instrument, the number of well-defined indicators per factor, and the interpretability of neighboring factor-count solutions (Horn, 1965; Worthington & Whittaker, 2006). The final SPSS workflow estimated the selected 11-factor solution together with neighboring 10- and 12-factor sensitivity models.
Factor Loadings, Cross-Loadings, and Item Refinement
For each candidate solution, the primary factor loadings, secondary loadings, communalities, and factor membership were examined. A primary loading below approximately .40 in absolute value, a communality below approximately .30, or a secondary pattern loading with an absolute value of at least .30 and a difference of less than .20 from the primary loading indicated that an item required closer review. Because Direct Oblimin allows the factors to be correlated, cross-loading decisions were based primarily on the pattern matrix rather than on secondary coefficients in the structure matrix.
Item refinement was conducted iteratively. When an item showed multiple concerns, such as a weak corrected item-total correlation together with weak or conceptually ambiguous factor behavior, it was considered for removal and the reliability analysis and EFA were repeated. The objective was not to maximize alpha mechanically but to obtain a parsimonious and conceptually defensible item set with adequate primary loadings, limited cross-loadings, and acceptable internal consistency.
The GREPS documentation identified MQ6_R, BEL5_R, ABS4, and PI5_R as items requiring particular psychometric review. Although these items remained in the original dataset, they were evaluated for exclusion from the strict reflective measurement model. The initial 50-item solution was compared with a refined 46-item solution excluding these four items, and the refined solution was retained only if the reliability, factor structure, and substantive coherence were improved.
Software and Reproducibility
IBM SPSS Statistics was used for the reportable reliability analyses and EFA. The syntax reverse-coded items without overwriting the originals, restricted analyses to the EFA development sample, estimated initial and refined reliability models, fitted Principal Axis Factoring models with Direct Oblimin rotation, and retained an unsuppressed loading audit with 10- and 12-factor sensitivity runs. The auxiliary R workflow was used only for discovery and sensitivity assessment; the principal numerical results reported below were from SPSS.
Synthetic-data disclosure: GREPS is a synthetic case-study dataset. No real people were recruited, surveyed, or observed. These analyses are intended solely to demonstrate psychological scale development, reliability analysis, exploratory factor analysis, item refinement, and statistical reporting; the findings must not be interpreted as empirical evidence about real graduate students or universities.
Findings
Initial Item Review and Scale Refinement
The initial reliability analyses were conducted separately for the 11 proposed reflective dimensions. Most dimensions showed acceptable internal consistency, but removal of the four prespecified review items (MQ6_R, BEL5_R, ABS4, and PI5_R) consistently improved reliability in the affected subscales. The clearest case was ABS4: research absorption had an initial alpha of .692, ABS4 had a corrected item-total correlation of .304, and alpha increased to .731 when the item was deleted. The reverse-coded mentoring, belonging, and persistence review items also had weaker item-total relationships than the other items in their respective scales, and alpha increased when each was removed.
Table 1
Initial reliability evidence for the four prespecified review items
| Review item | Proposed dimension | Initial α | Item-total r | α if item deleted | Decision |
|---|---|---|---|---|---|
| MQ6_R | Mentoring Quality | .838 | .393 | .857 | Exclude |
| BEL5_R | Academic Belonging | .798 | .417 | .813 | Exclude |
| ABS4 | Research Absorption | .692 | .304 | .731 | Exclude |
| PI5_R | Persistence Intentions | .809 | .437 | .825 | Exclude |
Note. Corrected item-total correlations and alpha-if-deleted values are from the initial SPSS reliability analyses. Exclusion decisions were based on the combined reliability, factor-analytic, wording, and content evidence rather than on alpha alone.
Based on the combined evidence, the four review items were excluded from the strict reflective measurement model while remaining unchanged in the source dataset. The resulting item pool contained 46 items. The final pool consisted of five Mentoring Quality items; four Peer Research Support items; six Research Self-Efficacy items; four Academic Belonging items; four Research Vigor items; four Research Dedication items; three Research Absorption items; four Research Exhaustion items; four Research Cynicism items; four Cognitive Weariness items; and four Persistence Intentions items.
Suitability of the Final Item Pool for Factor Analysis
The refined 46-item pool was evaluated using the EFA development sample. The Kaiser-Meyer-Olkin measure was .930, indicating strong sampling adequacy. Bartlett's test of sphericity was statistically significant, χ²(1035) = 8,985.210, p < .001, indicating that the correlation matrix differed from an identity matrix. These results provided support for proceeding with the exploratory factor analysis.
Table 2
Factorability and extraction results for the final 46-item pool
| Statistic | Result |
|---|---|
| EFA development sample | n = 450 |
| Kaiser-Meyer-Olkin measure | .930 |
| Bartlett's test of sphericity | χ²(1035) = 8,985.210, p < .001 |
| Extraction method | Principal Axis Factoring |
| Rotation | Direct Oblimin (delta = 0), Kaiser normalization |
| Retained factors | 11 |
| Initial variance, Factors 1-11 | 64.805% |
| Extracted common variance, Factors 1-11 | 53.818% |
| Rotation convergence | 16 iterations |
Note. The EFA used pairwise correlations within the development sample. Because the retained factors were obliquely rotated and therefore correlated, the rotated sums of squared loadings are not additive.
Factor Retention
Factor retention was evaluated using several sources of evidence rather than a single decision rule. In the final SPSS correlation matrix, the first 11 initial eigenvalues were greater than 1.00; the 11th eigenvalue was 1.054, whereas the 12th eigenvalue decreased to .771. The first 11 initial eigenvalues accounted for 64.805% of the total item variance. The auxiliary ordinal-data discovery stage suggested 11 factors for the refined polychoric matrix, whereas the Pearson parallel analysis suggested 10. The theoretical measurement specification also included 11 first-order reflective dimensions.
The neighboring SPSS sensitivity models also supported retention of 11 factors. The 10-factor model extracted 52.201% of the common variance, whereas the selected 11-factor model extracted 53.818%. The 12-factor sensitivity model produced only a modest increase in cumulative extracted variance and yielded a very small 12th factor (extraction sum of squared loadings = .328, 0.714% of variance; rotated sum of squared loadings = .367). This additional factor was essentially independent of the remaining factors, with correlations no larger than .074 in absolute value. Together with the substantive interpretability of the 11-factor solution, these results supported retaining 11 factors.
Figure 1
Scree plot for the final 46-item exploratory factor analysis
Final 46-Item Factor Structure
The final 46-item model was estimated using Principal Axis Factoring with Direct Oblimin rotation, and rotation converged in 16 iterations. The pattern matrix showed a clear 11-factor structure corresponding to Research Self-Efficacy, Cognitive Weariness, Research Cynicism, Peer Research Support, Mentoring Quality, Academic Belonging, Research Absorption, Research Dedication, Research Vigor, Persistence Intentions, and Research Exhaustion. All retained items had primary pattern loadings greater than .50 in absolute value. Extraction communalities ranged from .381 to .641; thus, every retained item exceeded the .30 communality review criterion.
Table 3
Final 46-item Principal Axis Factoring solution with Direct Oblimin rotation
| Factor | Interpreted dimension | Retained items | Absolute pattern-loading range |
|---|---|---|---|
| 1 | Research Self-Efficacy | RSE1-RSE6 | .578-.676 |
| 2 | Cognitive Weariness | CW1-CW3, CW4_R | .516-.762 |
| 3 | Research Cynicism | CYN1-CYN3, CYN4_R | .640-.787 |
| 4 | Peer Research Support | PRS1-PRS4 | .573-.723 |
| 5 | Mentoring Quality | MQ1-MQ5 | .614-.722 |
| 6 | Academic Belonging | BEL1-BEL4 | .586-.698 |
| 7 | Research Absorption | ABS1-ABS3 | .543-.724 |
| 8 | Research Dedication | DED1-DED4 | .588-.715 |
| 9 | Research Vigor | VIG1-VIG4 | .523-.606 |
| 10 | Persistence Intentions | PI1-PI4 | .635-.721 |
| 11 | Research Exhaustion | EXH1-EXH4 | .508-.662 |
Note. Loadings are from the SPSS pattern matrix; coefficients below .30 in absolute value were suppressed in the reportable output. Research Dedication and Research Vigor had negative pattern loadings because factor polarity is arbitrary; absolute loading magnitudes are shown. No retained item had a secondary pattern loading with an absolute value of .30 or above.
No retained item had a secondary pattern loading with an absolute value of .30 or above, indicating a strong simple structure for the refined solution. As expected with correlated factors under oblique rotation, the structure matrix contained several larger secondary item-factor associations; these were not interpreted as pattern cross-loadings. Factor correlations were nonzero and reached an absolute magnitude of .474, providing empirical support for the use of an oblique rather than orthogonal rotation.
Internal Consistency of the Final Subscales
After the 46-item factor structure was fixed, Cronbach's alpha was re-estimated separately for each retained subscale. All 11 final subscales met or exceeded the .70 guideline specified in the analysis plan. Alpha coefficients ranged from .730 for Research Absorption to .874 for Research Self-Efficacy. Corrected item-total correlations for the retained items remained above the .30 review threshold, and the combined reliability and factor-analytic evidence did not support any additional item deletion.
Table 4
Cronbach's alpha coefficients for the final retained subscales
| Subscale | Items | Valid N | Cronbach's α |
|---|---|---|---|
| Mentoring Quality | 5 | 446 | .857 |
| Peer Research Support | 4 | 443 | .796 |
| Research Self-Efficacy | 6 | 437 | .874 |
| Academic Belonging | 4 | 443 | .812 |
| Research Vigor | 4 | 438 | .777 |
| Research Dedication | 4 | 441 | .837 |
| Research Absorption | 3 | 446 | .730 |
| Research Exhaustion | 4 | 433 | .812 |
| Research Cynicism | 4 | 438 | .823 |
| Cognitive Weariness | 4 | 440 | .776 |
| Persistence Intentions | 4 | 436 | .825 |
Note. Valid N differs across subscales because SPSS reliability analysis used scale-specific listwise deletion. The EFA itself used pairwise correlations within the 450-case development sample.
Summary
The scale-development analyses supported a refined 46-item, 11-dimension reflective measurement structure in the synthetic GREPS development sample. Four prespecified review items—MQ6_R, BEL5_R, ABS4, and PI5_R—were excluded from the strict model after the reliability, item-level, factor-analytic, wording, and content evidence were considered together. The final item pool demonstrated strong factorability (KMO = .930; Bartlett's χ²(1035) = 8,985.210, p < .001) and produced 11 interpretable factors using Principal Axis Factoring with Direct Oblimin rotation.
The final pattern matrix showed primary loading magnitudes ranging from .508 to .787, with no secondary pattern loading having an absolute value of .30 or above, and extraction communalities ranged from .381 to .641. The factors were meaningfully correlated, supporting the use of an oblique rotation. Final Cronbach's alpha coefficients ranged from .730 to .874 across the 11 retained subscales. Taken together, the SPSS results supported the internal consistency and exploratory factorial structure of the refined item set for this synthetic methodological demonstration. These findings are illustrative and should not be interpreted as empirical evidence about real graduate students or institutions.
References
Bartlett, M. S. (1954). A note on the multiplying factors for various chi-square approximations. Journal of the Royal Statistical Society: Series B (Methodological), 16(2), 296-298. https://doi.org/10.1111/j.2517-6161.1954.tb00174.x
Cronbach, L. J. (1951). Coefficient alpha and the internal structure of tests. Psychometrika, 16(3), 297-334. https://doi.org/10.1007/BF02310555
Fabrigar, L. R., Wegener, D. T., MacCallum, R. C., & Strahan, E. J. (1999). Evaluating the use of exploratory factor analysis in psychological research. Psychological Methods, 4(3), 272-299. https://doi.org/10.1037/1082-989X.4.3.272
Horn, J. L. (1965). A rationale and test for the number of factors in factor analysis. Psychometrika, 30(2), 179-185. https://doi.org/10.1007/BF02289447
Kaiser, H. F. (1970). A second generation little jiffy. Psychometrika, 35(4), 401-415. https://doi.org/10.1007/BF02291817
Worthington, R. L., & Whittaker, T. A. (2006). Scale development research: A content analysis and recommendations for best practices. The Counseling Psychologist, 34(6), 806-838. https://doi.org/10.1177/0011000006288127
Need help with a similar research question?
Share a short, non-confidential summary of your study and the decision you need to make.