
Mediation Analysis – Indirect effects, serial pathways, robust inference, and hypothesis testing
Synthetic methodological demonstration
Created from scratch with synthetic data and reconstructed context. No client data or original client document is used.
Analysis Plan
Three prespecified mediation hypotheses were tested for the synthetic Graduate Research Engagement and Persistence Study (GREPS). IBM SPSS Statistics was used to perform composite scoring, regression diagnostics, and mediation analysis, and Andrew F. Hayes's PROCESS macro was used to estimate the regression-based indirect-effect models. H1 and H2 were tested using PROCESS Model 6 because each specified a serial two-mediator pathway, whereas H3 was tested using PROCESS Model 4 because it specified a single mediator (Hayes, 2022; Hayes & Rockwood, 2017).
Hypothesis 1 (H1) predicted a positive serial indirect association between the Research Support Ecosystem and Persistence Intentions through Research Self-Efficacy and then Academic Research Engagement. Hypothesis 2 (H2) predicted a positive serial indirect association between the Research Support Ecosystem and Persistence Intentions through Academic Belonging and then Academic Research Engagement. Hypothesis 3 (H3) predicted a negative indirect association between Structural Barrier Load and Persistence Intentions through Graduate Research Burnout.
The Research Support Ecosystem was operationalized as an equal-weight mean of standardized Mentoring Quality, Peer Research Support, and Research Resource Adequacy scores. A common complete-case pool was used for H1 and H2 so that the three lower-order support components were standardized using the same analytic cases. The serial mediation analyses included 891 cases, with nine cases excluded because of incomplete data required for the common H1/H2 analysis pool. H3 was estimated using 900 cases.
All models adjusted for degree type, enrollment status, instruction modality, completed graduate methods/statistics courses, weekly paid-work hours outside the research role, first-generation status, international-student status, and caregiving responsibilities. Degree type, enrollment status, and instruction modality were dummy coded, with master's, full-time, and primarily in-person students serving as the respective reference categories.
Mediation Analysis Strategy
Indirect effects were evaluated using 10,000 percentile bootstrap resamples and 95% bootstrap confidence intervals. The primary criterion for inference was whether the 95% confidence interval for the prespecified indirect effect excluded zero and whether the direction of the effect was consistent with the hypothesized direction. This bootstrap procedure avoids reliance on the normal-theory assumption for the sampling distribution of the product of mediation paths (Preacher & Hayes, 2008; Hayes, 2022). A statistically significant total effect was not required to evaluate an indirect effect.
The regression equations in the primary mediation models were estimated using HC3 heteroskedasticity-consistent standard errors and 95% confidence intervals. HC3 inference was prespecified to reduce the dependence of path-level tests on the assumption of constant residual variance (Long & Ervin, 2000). Completely standardized indirect effects were reported as supplementary effect-size information, whereas the unstandardized indirect effects and their bootstrap confidence intervals were treated as the primary reporting quantities.
Because respondents were nested within 15 anonymous institutions, all three mediation hypotheses were repeated in sensitivity analyses using institution-clustered robust standard errors and cluster-level bootstrap resampling. These analyses were conducted to determine whether the indirect-effect conclusions were robust to within-institution dependence. Given that only 15 clusters were available, the cluster-based results were interpreted cautiously and were not used to replace the prespecified primary HC3 analyses (Cameron & Miller, 2015).
Assumption Testing
The constituent regression equations for the three mediation models were evaluated separately using standard SPSS regression diagnostics. Residual normality was examined using histograms and Normal P-P plots of standardized residuals. Linearity and variance behavior were assessed using scatterplots of standardized residuals against standardized predicted values. Standardized residuals were also examined for unusually extreme cases, while tolerance and variance inflation factor (VIF) statistics were used to assess multicollinearity.
These diagnostics were treated as model-quality checks rather than rigid pass/fail criteria. Inference for the indirect effects was based on bootstrap confidence intervals, while HC3 standard errors were used for the regression paths. Accordingly, modest residual nonnormality or unequal variance was considered when interpreting the models without automatically invalidating an otherwise well-specified analysis. No broad descriptive-statistics procedure or post hoc power analysis was included.
Hypothesis Decision Rules
H1 was considered supported when the specific serial indirect effect Research Support Ecosystem -> Research Self-Efficacy -> Academic Research Engagement -> Persistence Intentions was positive and its 95% bootstrap confidence interval excluded zero. The same decision rule was applied to H2 for the pathway Research Support Ecosystem -> Academic Belonging -> Academic Research Engagement -> Persistence Intentions. H3 was considered supported when the indirect effect Structural Barrier Load -> Graduate Research Burnout -> Persistence Intentions was negative and its 95% bootstrap confidence interval excluded zero.
Direct and total effects were reported to describe the broader regression pattern, but neither was treated as a prerequisite for mediation. Because GREPS is synthetic and represents a cross-sectional, nonexperimental case-study design, the findings are described as indirect associations and statistical pathways rather than as evidence that one variable causally produces change in another.
Findings
Mediation Model 1: Research Support Ecosystem, Research Self-Efficacy, Engagement, and Persistence
Assessment of the Assumptions of Mediation Model 1
The three regression equations for H1 showed generally acceptable diagnostic behavior. The residual histograms for Research Self-Efficacy and Academic Research Engagement were approximately symmetric, and their Normal P-P plots followed the diagonal closely. The residual-versus-predicted plots showed no pronounced curvature or funnel pattern. Although a small number of standardized residuals exceeded an absolute value of 3, the distributions were not dominated by extreme cases.
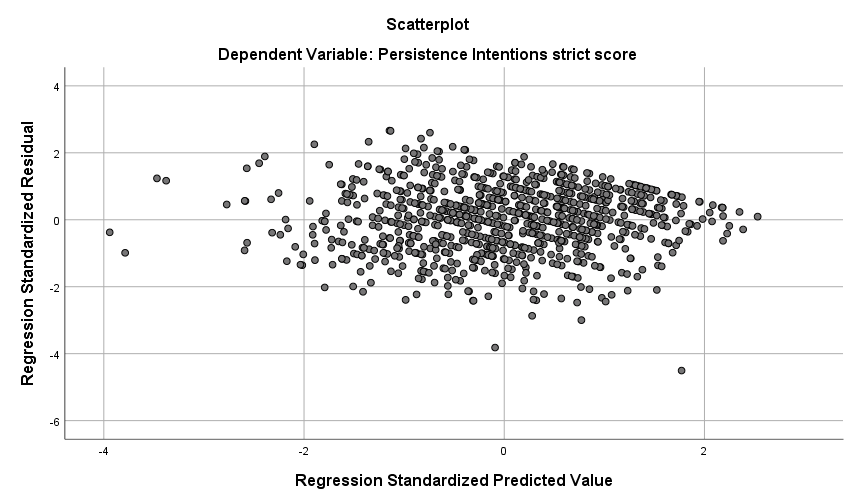
For the final Persistence Intentions equation, the residual distribution showed a modest negative tail, with the most extreme standardized residual approximately -4.51; however, the P-P plot remained close to the diagonal across most of the distribution. The residual-versus-predicted plot showed some variation in spread across fitted values but no strong nonlinear pattern. Multicollinearity was not problematic across the H1 equations, with VIF values remaining below approximately 2.0. Given the prespecified HC3 path inference and bootstrap confidence intervals for the indirect effects, the diagnostic results were considered adequate for the planned analysis.
Figure 1
Histogram of standardized residuals for the final Persistence Intentions equation in Mediation Model 1
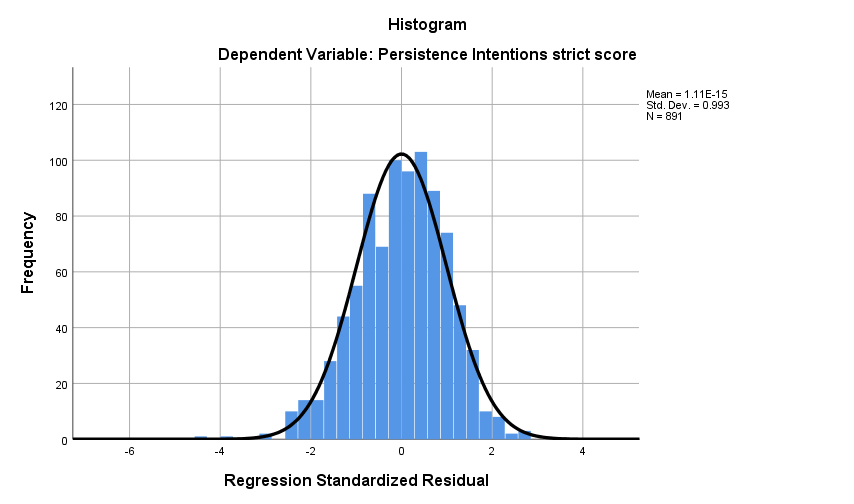
Figure 2
Normal P-P plot of standardized residuals for the final Persistence Intentions equation in Mediation Model 1
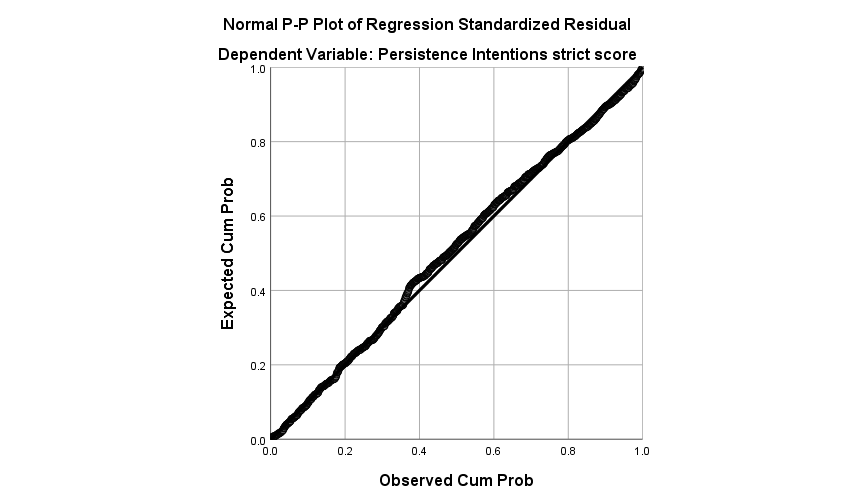
Figure 3
Standardized residuals against standardized predicted values for the final Persistence Intentions equation in Mediation Model 1
Results of Mediation Model 1
The first regression equation predicting Research Self-Efficacy was statistically significant, R = .491, R Square = .241, F(HC3)(10, 880) = 31.272, p < .001. Research Support Ecosystem had a positive association with Research Self-Efficacy, B = .823, HC3 SE = .052, t = 15.736, p < .001, 95% CI [.721, .926].
The second regression equation predicting Academic Research Engagement was also statistically significant, R = .700, R Square = .491, F(HC3)(11, 879) = 71.444, p < .001. Research Support Ecosystem (B = .452, HC3 SE = .039, p < .001) and Research Self-Efficacy (B = .377, HC3 SE = .023, p < .001) were both positively associated with Academic Research Engagement. The final equation predicting Persistence Intentions was statistically significant, R = .611, R Square = .373, F(HC3)(12, 878) = 46.924, p < .001. Research Support Ecosystem (B = .397, p < .001), Research Self-Efficacy (B = .180, p < .001), and Academic Research Engagement (B = .406, p < .001) each had positive associations with Persistence Intentions.
Table 1
Model summaries for the regression equations in Mediation Model 1
| Outcome | R | R Square | F(HC3) | df | p-value |
|---|---|---|---|---|---|
| Research Self-Efficacy | .4912 | .2413 | 31.2717 | 10, 880 | < .001 |
| Academic Research Engagement | .7004 | .4906 | 71.4441 | 11, 879 | < .001 |
| Persistence Intentions | .6107 | .3730 | 46.9242 | 12, 878 | < .001 |
Table 2
Focal path estimates for Mediation Model 1
| Unstandardized Coefficients | 95% CI | |||||
|---|---|---|---|---|---|---|
| Path | B | HC3 SE | t | p-value | LLCI, ULCI | |
| Support Ecosystem -> Self-Efficacy | .8232 | .0523 | 15.736 | < .001 | [.7205, .9258] | |
| Support Ecosystem -> Engagement | .4522 | .0392 | 11.539 | < .001 | [.3753, .5291] | |
| Self-Efficacy -> Engagement | .3765 | .0225 | 16.721 | < .001 | [.3323, .4207] | |
| Support Ecosystem -> Persistence (direct) | .3974 | .0609 | 6.527 | < .001 | [.2779, .5169] | |
| Self-Efficacy -> Persistence | .1801 | .0374 | 4.822 | < .001 | [.1068, .2535] | |
| Engagement -> Persistence | .4055 | .0473 | 8.579 | < .001 | [.3128, .4983] | |
| Support Ecosystem -> Persistence (total) | .8548 | .0534 | 16.001 | < .001 | [.7499, .9596] | |
Note. All equations included the prespecified covariates. HC3 = heteroskedasticity-consistent standard error estimator. The total effect is from the model without the mediators; the direct effect controls for both serial mediators.
The total indirect association between Research Support Ecosystem and Persistence Intentions was .4573, with a 95% bootstrap CI [.3784, .5396]. The specific indirect effect through Research Self-Efficacy alone was .1483, 95% bootstrap CI [.0865, .2129], while the indirect effect through Academic Research Engagement alone was .1834, 95% bootstrap CI [.1343, .2373]. For H1, the prespecified serial indirect effect through Research Self-Efficacy and then Academic Research Engagement was .1257, BootSE = .0188, with a 95% bootstrap CI [.0907, .1646]. The corresponding completely standardized serial indirect effect was .0695, 95% bootstrap CI [.0506, .0904].
Table 3
Bootstrap indirect effects for Mediation Model 1
| Indirect pathway | Effect | BootSE | BootLLCI | BootULCI |
|---|---|---|---|---|
| Total indirect effect | .4573 | .0418 | .3784 | .5396 |
| Support -> Self-Efficacy -> Persistence | .1483 | .0321 | .0865 | .2129 |
| Support -> Engagement -> Persistence | .1834 | .0263 | .1343 | .2373 |
| Support -> Self-Efficacy -> Engagement -> Persistence | .1257 | .0188 | .0907 | .1646 |
Hypothesis 1
Hypothesis 1 was supported. The specific serial indirect association between Research Support Ecosystem and Persistence Intentions through Research Self-Efficacy and then Academic Research Engagement was positive, and the 95% bootstrap confidence interval did not include zero. The direct association between Research Support Ecosystem and Persistence Intentions remained statistically significant after both mediators were included, indicating that the modeled indirect pathway accounted for part, but not all, of the overall statistical association.
Mediation Model 2: Research Support Ecosystem, Academic Belonging, Engagement, and Persistence
Assessment of the Assumptions of Mediation Model 2
The Academic Belonging and Academic Research Engagement equations showed approximately bell-shaped residual distributions, Normal P-P plots close to the diagonal, and residual-versus-predicted plots without pronounced nonlinear structure. Although a few standardized residuals were slightly beyond +/-3, no broad distributional failure was evident.
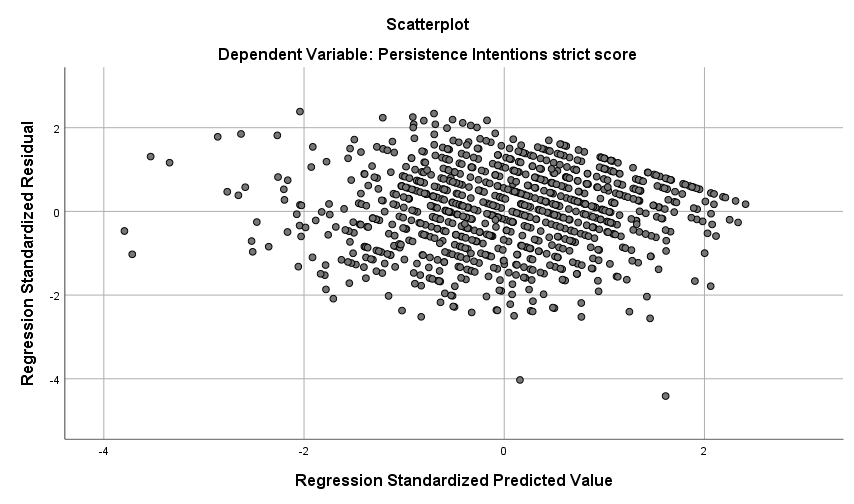
The final Persistence Intentions equation again showed a small negative tail, with the largest negative standardized residual approximately -4.41. Nevertheless, the P-P plot remained close to the diagonal over most of the distribution, and the residual-versus-predicted plot showed no severe curvature. VIF values across the H2 equations remained below approximately 1.72, indicating no problematic multicollinearity among the serial predictor and mediator terms. Taken together with the robust and bootstrap procedures used for inference, the diagnostic findings were considered acceptable.
Figure 4
Histogram of standardized residuals for the final Persistence Intentions equation in Mediation Model 2
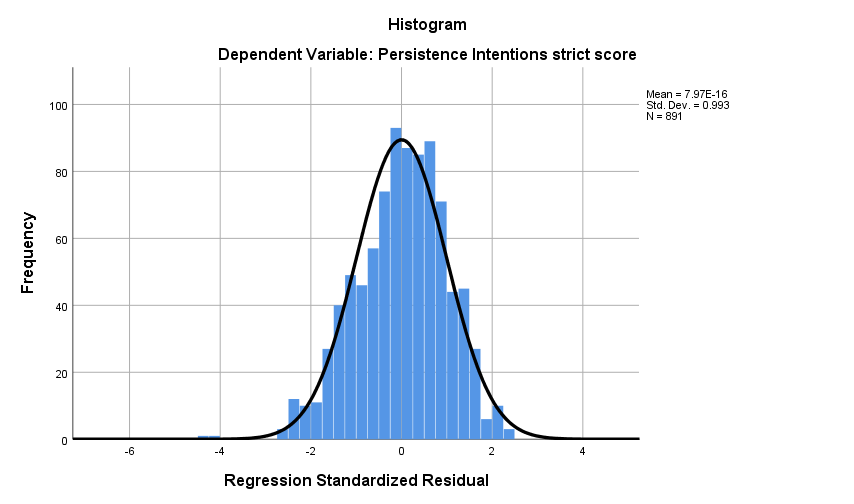
Figure 5
Normal P-P plot of standardized residuals for the final Persistence Intentions equation in Mediation Model 2
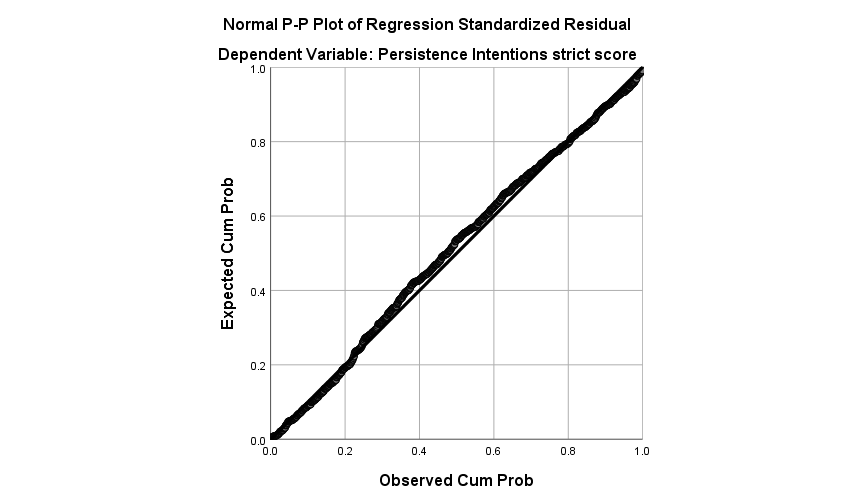
Figure 6
Standardized residuals against standardized predicted values for the final Persistence Intentions equation in Mediation Model 2
Results of Mediation Model 2
The first regression equation predicting Academic Belonging was statistically significant, R = .544, R Square = .296, F(HC3)(10, 880) = 44.242, p < .001. Research Support Ecosystem had a strong positive association with Academic Belonging, B = .991, HC3 SE = .049, t = 20.324, p < .001, 95% CI [.895, 1.086].
The regression equation predicting Academic Research Engagement was statistically significant, R = .646, R Square = .417, F(HC3)(11, 879) = 55.184, p < .001. Research Support Ecosystem (B = .482, HC3 SE = .043, p < .001) and Academic Belonging (B = .283, HC3 SE = .024, p < .001) were each positively associated with Academic Research Engagement. The final Persistence Intentions equation was statistically significant, R = .615, R Square = .379, F(HC3)(12, 878) = 49.170, p < .001. Research Support Ecosystem (B = .338, p < .001), Academic Belonging (B = .192, p < .001), and Academic Research Engagement (B = .429, p < .001) each had positive associations with Persistence Intentions.
Table 4
Model summaries for the regression equations in Mediation Model 2
| Outcome | R | R Square | F(HC3) | df | p-value |
|---|---|---|---|---|---|
| Academic Belonging | .5436 | .2955 | 44.2421 | 10, 880 | < .001 |
| Academic Research Engagement | .6455 | .4167 | 55.1837 | 11, 879 | < .001 |
| Persistence Intentions | .6153 | .3786 | 49.1700 | 12, 878 | < .001 |
Table 5
Focal path estimates for Mediation Model 2
| Unstandardized Coefficients | 95% CI | |||||
|---|---|---|---|---|---|---|
| Path | B | HC3 SE | t | p-value | LLCI, ULCI | |
| Support Ecosystem -> Academic Belonging | .9907 | .0487 | 20.324 | < .001 | [.8950, 1.0864] | |
| Support Ecosystem -> Engagement | .4816 | .0428 | 11.253 | < .001 | [.3976, .5656] | |
| Academic Belonging -> Engagement | .2831 | .0239 | 11.864 | < .001 | [.2363, .3299] | |
| Support Ecosystem -> Persistence (direct) | .3379 | .0634 | 5.330 | < .001 | [.2135, .4623] | |
| Academic Belonging -> Persistence | .1920 | .0340 | 5.642 | < .001 | [.1252, .2587] | |
| Engagement -> Persistence | .4287 | .0441 | 9.729 | < .001 | [.3422, .5152] | |
| Support Ecosystem -> Persistence (total) | .8548 | .0534 | 16.001 | < .001 | [.7499, .9596] | |
Note. All equations included the prespecified covariates. The same Research Support Ecosystem total-effect model was used for H1 and H2 because the predictor, outcome, covariates, and common complete-case analysis pool were identical.
The total indirect association was .5169, 95% bootstrap CI [.4336, .6029]. The indirect effect through Academic Belonging alone was .1902, 95% bootstrap CI [.1213, .2596], while the indirect effect through Academic Research Engagement alone was .2065, 95% bootstrap CI [.1539, .2653]. The H2-specific serial indirect effect through Academic Belonging and then Academic Research Engagement was .1202, BootSE = .0170, 95% bootstrap CI [.0894, .1557]. The corresponding completely standardized serial indirect effect was .0665, 95% bootstrap CI [.0494, .0859].
Table 6
Bootstrap indirect effects for Mediation Model 2
| Indirect pathway | Effect | BootSE | BootLLCI | BootULCI |
|---|---|---|---|---|
| Total indirect effect | .5169 | .0435 | .4336 | .6029 |
| Support -> Belonging -> Persistence | .1902 | .0349 | .1213 | .2596 |
| Support -> Engagement -> Persistence | .2065 | .0284 | .1539 | .2653 |
| Support -> Belonging -> Engagement -> Persistence | .1202 | .0170 | .0894 | .1557 |
Hypothesis 2
Hypothesis 2 was supported. The serial indirect association between Research Support Ecosystem and Persistence Intentions through Academic Belonging and then Academic Research Engagement was positive, and the bootstrap confidence interval was entirely above zero. The direct association between Research Support Ecosystem and Persistence Intentions remained statistically significant after the mediators were included, indicating that the indirect pathway represented one component of the broader statistical association rather than the entire relationship.
Mediation Model 3: Structural Barrier Load, Burnout, and Persistence
Assessment of the Assumptions of Mediation Model 3
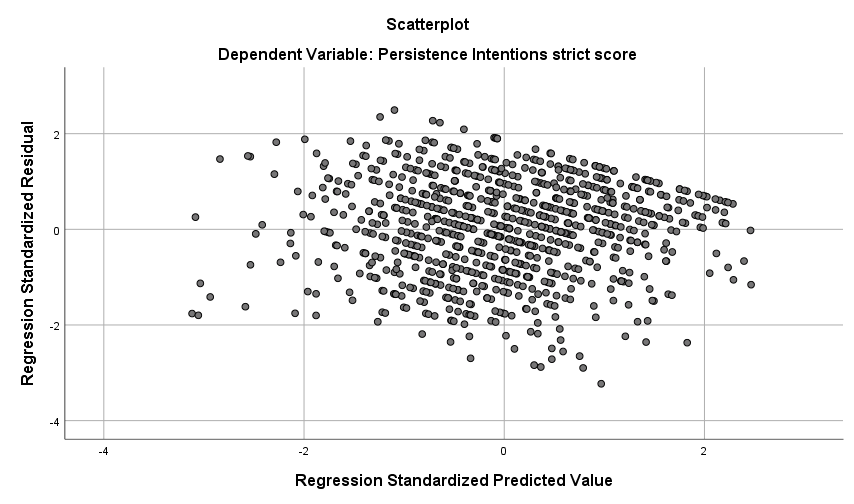
The Graduate Research Burnout equation showed a broadly symmetric residual histogram, a Normal P-P plot close to the diagonal, and a residual-versus-predicted plot without a pronounced nonlinear pattern. The most extreme standardized residuals remained below an absolute value of 3. The final Persistence Intentions equation showed a modest negative tail, with the largest standardized residual approximately -3.23; however, the distribution remained reasonably regular overall, and the P-P plot showed only modest deviation in the lower tail.
The final residual-versus-predicted plot showed no severe curvature, although some variation in residual spread was visible across predicted values. Multicollinearity was minimal across the H3 equations, with VIF values well below 1.3 for the focal predictor, mediator, and covariates. In combination with HC3 standard errors for the regression paths and bootstrap inference for the indirect effect, the diagnostic findings were considered sufficient for the planned mediation analysis.
Figure 7
Histogram of standardized residuals for the final Persistence Intentions equation in Mediation Model 3
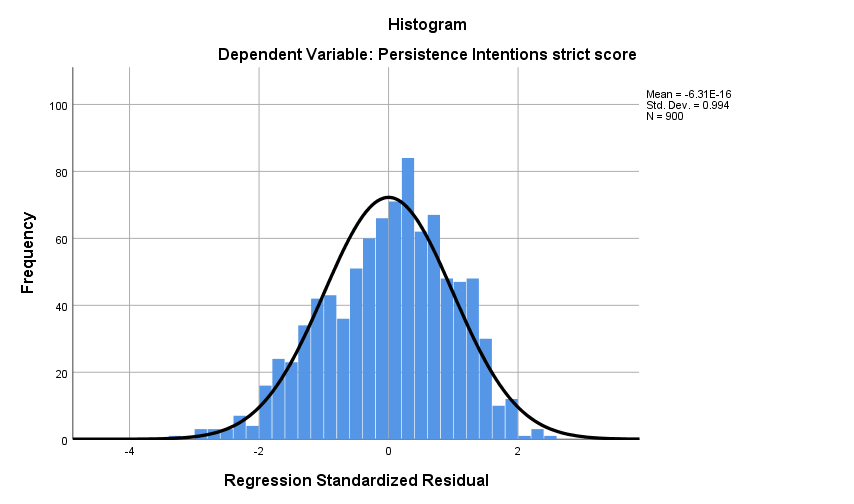
Figure 8
Normal P-P plot of standardized residuals for the final Persistence Intentions equation in Mediation Model 3
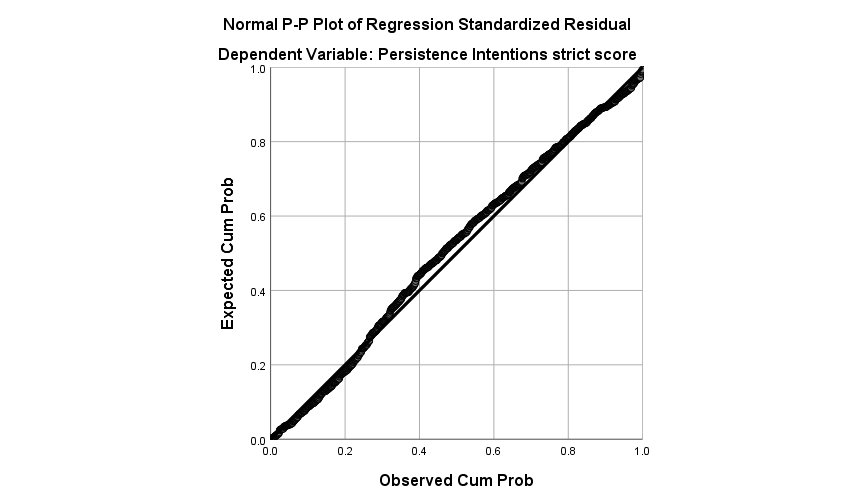
Figure 9
Standardized residuals against standardized predicted values for the final Persistence Intentions equation in Mediation Model 3
Results of Mediation Model 3
The mediator equation predicting Graduate Research Burnout was statistically significant, R = .430, R Square = .185, F(HC3)(10, 889) = 20.218, p < .001. Structural Barrier Load had a positive association with Graduate Research Burnout, B = .391, HC3 SE = .039, t = 9.993, p < .001, 95% CI [.315, .468].
The outcome equation predicting Persistence Intentions was statistically significant, R = .504, R Square = .254, F(HC3)(11, 888) = 28.926, p < .001. Graduate Research Burnout had a strong negative association with Persistence Intentions, B = -.598, HC3 SE = .039, t = -15.288, p < .001, 95% CI [-.674, -.521]. After Graduate Research Burnout was included, the direct coefficient for Structural Barrier Load was attenuated to B = -.088, HC3 SE = .047, t = -1.881, p = .060, 95% CI [-.179, .004]. In contrast, the total association between Structural Barrier Load and Persistence Intentions was negative and statistically significant, B = -.322, HC3 SE = .052, p < .001, 95% CI [-.423, -.221].
Table 7
Model summaries for Mediation Model 3
| Outcome | R | R Square | F(HC3) | df | p-value |
|---|---|---|---|---|---|
| Graduate Research Burnout | .4295 | .1845 | 20.2184 | 10, 889 | < .001 |
| Persistence Intentions | .5043 | .2543 | 28.9263 | 11, 888 | < .001 |
| Persistence Intentions: total-effect model | .2473 | .0611 | 5.8146 | 10, 889 | < .001 |
Table 8
Focal path, total-effect, and direct-effect estimates for Mediation Model 3
| Unstandardized Coefficients | 95% CI | |||||
|---|---|---|---|---|---|---|
| Path/effect | B | HC3 SE | t | p-value | LLCI, ULCI | |
| Structural Barriers -> Burnout | .3914 | .0392 | 9.993 | < .001 | [.3146, .4683] | |
| Burnout -> Persistence | -.5977 | .0391 | -15.288 | < .001 | [-.6744, -.5210] | |
| Structural Barriers -> Persistence (direct) | -.0877 | .0466 | -1.881 | .060 | [-.1791, .0038] | |
| Structural Barriers -> Persistence (total) | -.3216 | .0515 | -6.245 | < .001 | [-.4227, -.2205] | |
The indirect association through Graduate Research Burnout was -.2340, BootSE = .0275, with a 95% bootstrap CI [-.2890, -.1822]. Because the confidence interval excluded zero and the effect was negative, the result was consistent with the hypothesized pathway in which greater Structural Barrier Load was associated with greater Graduate Research Burnout, which in turn was associated with lower Persistence Intentions. The completely standardized indirect effect was -.1628, 95% bootstrap CI [-.2005, -.1275].
Table 9
Bootstrap indirect effect for Mediation Model 3
| Indirect pathway | Effect | BootSE | BootLLCI | BootULCI |
|---|---|---|---|---|
| Structural Barriers -> Burnout -> Persistence | -.2340 | .0275 | -.2890 | -.1822 |
| Completely standardized indirect effect | -.1628 | .0187 | -.2005 | -.1275 |
Hypothesis 3
Hypothesis 3 was supported. Structural Barrier Load had a statistically reliable negative indirect association with Persistence Intentions through Graduate Research Burnout. After Graduate Research Burnout was included, the direct association between Structural Barrier Load and Persistence Intentions was no longer statistically distinguishable from zero at the .05 level. This pattern was consistent with a substantial indirect pathway through burnout; however, the cross-sectional design does not justify interpreting burnout as a demonstrated causal mechanism.
Institution-Clustered Sensitivity Analysis
The institution-clustered sensitivity models included 15 clusters and used cluster-level percentile bootstrap confidence intervals based on 10,000 resamples. The indirect-effect point estimates were unchanged because the regression coefficients were unchanged, while the bootstrap intervals reflected resampling at the institution level. The H1 serial indirect effect remained positive, .1257, 95% cluster-bootstrap CI [.0932, .1614]. The H2 serial indirect effect also remained positive, .1202, 95% cluster-bootstrap CI [.0873, .1557]. The H3 indirect effect remained negative, -.2340, 95% cluster-bootstrap CI [-.2886, -.1828].
All three clustered confidence intervals excluded zero and were consistent with the primary conclusions. Thus, the substantive conclusions for the indirect effects were not sensitive to adjustment for institution-level dependence. Because only 15 institutions were represented, the clustered analyses are best interpreted as robustness checks rather than as a stronger replacement for the prespecified primary analyses.
Table 10
Institution-clustered sensitivity results for the three prespecified indirect effects
| Hypothesis | Prespecified indirect effect | Effect | BootSE | 95% cluster-bootstrap CI | Conclusion |
|---|---|---|---|---|---|
| H1 | Support -> Self-Efficacy -> Engagement -> Persistence | .1257 | .0176 | [.0932, .1614] | Supported |
| H2 | Support -> Belonging -> Engagement -> Persistence | .1202 | .0174 | [.0873, .1557] | Supported |
| H3 | Barriers -> Burnout -> Persistence | -.2340 | .0269 | [-.2886, -.1828] | Supported |
Note. Clustered analyses used 15 institutions and 14 denominator degrees of freedom for cluster-robust t and F tests. Indirect-effect intervals were based on 10,000 cluster-level percentile bootstrap resamples.
Summary
Three mediation hypotheses were evaluated using regression-based indirect-effect models with 10,000 bootstrap resamples. H1 and H2 were estimated using serial PROCESS Model 6 specifications, whereas H3 was estimated using PROCESS Model 4. HC3 heteroskedasticity-consistent standard errors were used for the primary regression paths, and the prespecified indirect effects were evaluated using 95% bootstrap confidence intervals.
H1 was supported. Research Support Ecosystem had a positive serial indirect association with Persistence Intentions through Research Self-Efficacy and then Academic Research Engagement, indirect effect = .1257, 95% bootstrap CI [.0907, .1646]. H2 was also supported. The corresponding serial pathway through Academic Belonging and then Academic Research Engagement was positive, indirect effect = .1202, 95% bootstrap CI [.0894, .1557].
H3 was supported. Structural Barrier Load had a negative indirect association with Persistence Intentions through Graduate Research Burnout, indirect effect = -.2340, 95% bootstrap CI [-.2890, -.1822]. After burnout was included, the direct barrier-persistence coefficient was attenuated to p = .060, whereas the total barrier-persistence association was negative and statistically significant. This pattern was consistent with a prominent burnout-related indirect pathway but does not establish causal mediation.
The assumption diagnostics did not identify severe multicollinearity or a broad failure of linear-model form. Several final Persistence Intentions equations showed modest negative-tail outliers and some variation in residual dispersion; however, the Normal P-P plots were generally close to the diagonal, and the residual scatterplots showed no pronounced curvature. Accordingly, HC3 path inference and bootstrap confidence intervals for the indirect effects were retained as planned.
The institution-clustered sensitivity analyses produced the same conclusions for all three hypotheses, with each cluster-bootstrap confidence interval excluding zero in the same direction as the primary estimate. Because GREPS is synthetic and the represented design is cross-sectional and nonexperimental, these findings should be interpreted as a demonstration of mediation-analysis methodology and as evidence of statistical indirect associations within the synthetic data, rather than as causal evidence about real graduate students or institutions.
References
Hayes, A. F. (2022). Introduction to Mediation, Moderation, and Conditional Process Analysis: A Regression-Based Approach (3rd ed.). Guilford Press.
Hayes, A. F., & Rockwood, N. J. (2017). Regression-based statistical mediation and moderation analysis in clinical research: Observations, recommendations, and implementation. Behaviour Research and Therapy, 98, 39-57.
Preacher, K. J., & Hayes, A. F. (2008). Asymptotic and resampling strategies for assessing and comparing indirect effects in multiple mediator models. Behavior Research Methods, 40(3), 879-891.
Long, J. S., & Ervin, L. H. (2000). Using heteroscedasticity consistent standard errors in the linear regression model. The American Statistician, 54(3), 217-224.
Cameron, A. C., & Miller, D. L. (2015). A practitioner's guide to cluster-robust inference. Journal of Human Resources, 50(2), 317-372.
Need help with a similar research question?
Share a short, non-confidential summary of your study and the decision you need to make.